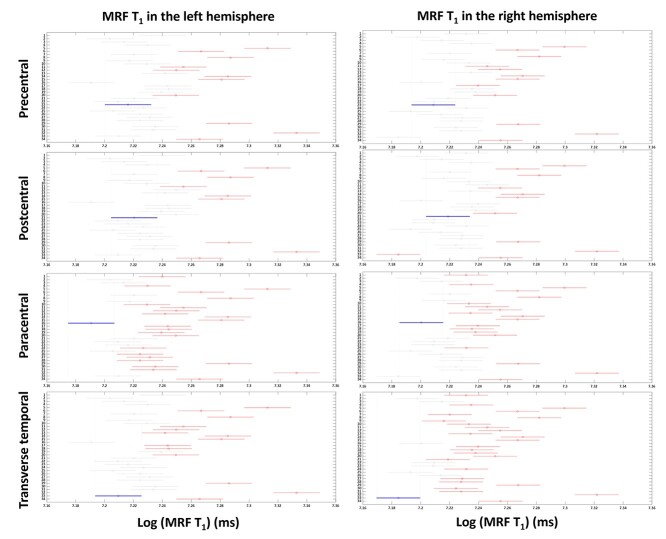
Fig. 5.
Tukey post-hoc results for MRF T1 values in left and right hemispheres. X-axis shows T1 values in a log scale and Y-axis shows labels of 34 brain regions (labels shown in Table 1). Red lines indicate the significant areas compared with the area indicated by the blue lines (precentral, postcentral, paracentral, and transverse temporal regions), after Tukey’s multiple comparison correction (P < 0.05).

