Fig. 2.
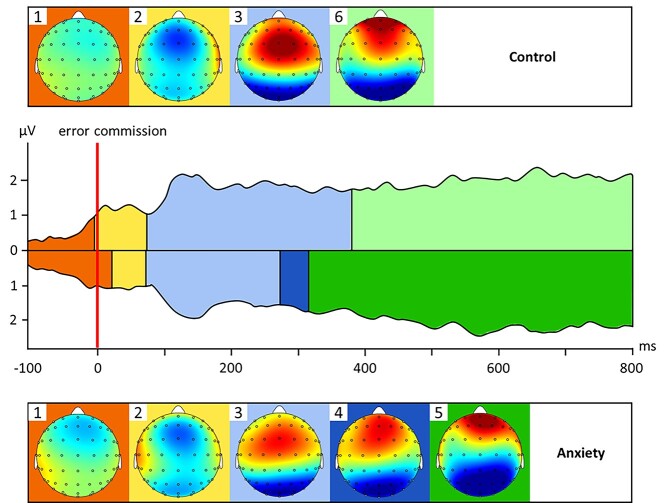
Microstate sequences in response to error commission in the Stroop across time (−100 to 800 ms after stimulus presentation), for the No-Anxiety Control (top) and Economic Anxiety (bottom) conditions, plotted over the Global Field Power (GFP), with corresponding topographies for each microstate (red indicates more positive values and blue indicates more negative values, referred to an average reference).

