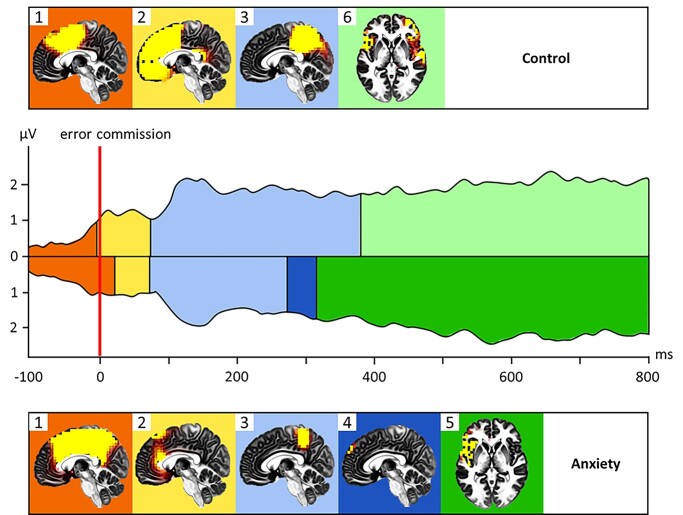
Fig. 3.
The sequence of cortical activation networks underlying each microstate in error commission for those in the No-Anxiety Control condition (top) and those in the Economic Anxiety condition (bottom). Microstates 1 and 2 image t-value threshold is set at t(91) = 6.00. Microstates 3, 5, and 6 image t-value threshold is set at t(91) = 4.00. Microstate 4 image t-value threshold is set at t(91) = 3.00 (activation in Microstate 4 did not cross the whole-brain corrected threshold for significance).

