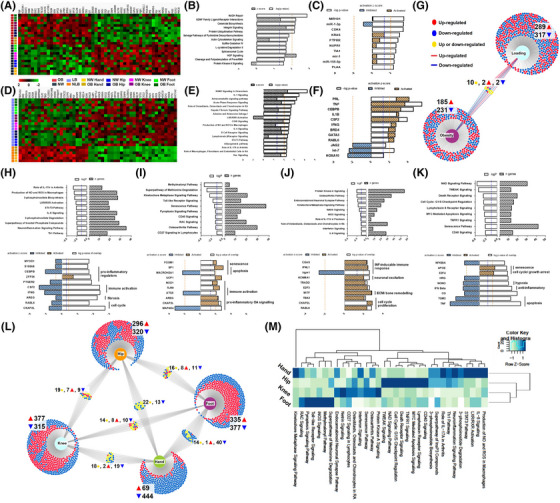
FIGURE 2.

Effects of obesity on synovial fibroblasts from different anatomical locations. (A and D) Heatmap of DEGs in normal weight (NW, n = 12) versus obese (OB, n = 12), and load‐bearing (LB, n = 18) versus non‐load bearing (NLB, n = 6). (B, E, H–K) Most significantly enriched canonical pathways associated with DEGs in OB versus NW, in LB versus NLB and in OB versus NW hand, hip, knee and foot joints, respectively. Orange dash line denotes IPA z‐score and blue dash line denotes p‐value significance threshold of .05. (C, F, H–K) Top enriched upstream regulators associated with DEGs in OB versus NW, in LB versus NLB and in OB versus NW hand, hip, knee and foot joints, respectively. Orange dash line denotes IPA predicted activation score and blue dash line denotes p‐value significance threshold of .05. (G) Graphical venn diagram illustrates the number of significant DEGs identified in obese and load‐bearing joints and the number of DEGs, which are shared between these two analyses. (L) Graphical venn diagram illustrates the number of significant DEGs identified in obese joints at different anatomical locations and the number of DEGs which are shared between these joints. (M) Heatmap comparing top canonical pathways enriched in obese patients for each joint depicted by p‐value of enrichment. DEGs identified ±1.5‐fold change, p < .05.
