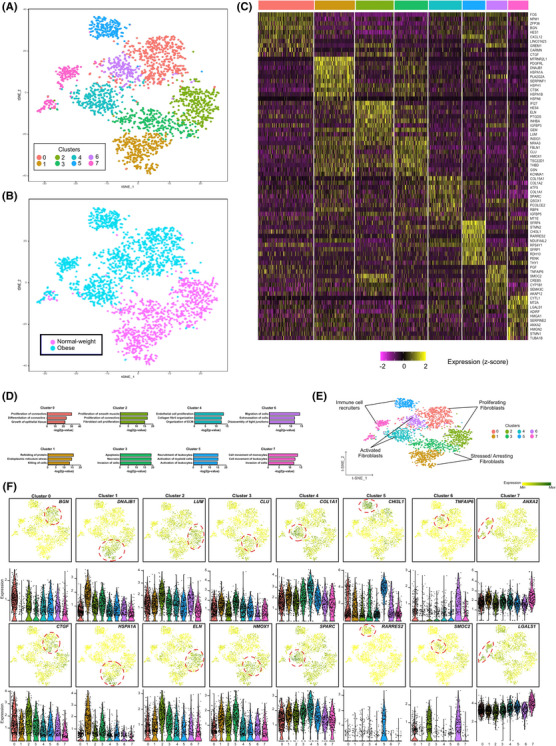
FIGURE 3.

Single cell RNA‐sequencing identifies distinct synovial fibroblasts subsets in obese and normal‐weight OA patients. (A) t‐SNE analysis of SF scRNAseq data showing eight fibroblast subsets. In total, scRNAseq was performed on 2485 SF from n = 4 normal‐weight OA patients and n = 4 obese OA patients. (B) t‐SNE plot showing the separation between fibroblasts from normal‐weight OA patients and fibroblasts from obese OA patients. (C) Heatmap showing the z‐score average gene signature expression of the top 10 most differentially expressed genes within each of the 8 SF clusters. (D) Significant biological processes for each cluster. Differentially expressed genes were analysed using IPA software. The significance of the association of a given disease function with the genes within a given subset was measured in two ways. Firstly, by the ratio of the number of differentially expressed genes in the dataset that mapped to the diseases/function divided by the total number of genes associated with that function. Secondly, Fisher's exact test was used to calculate a p‐value of the association between the genes and the disease function. (E) Clusters were assigned functional endotypes based on the canonical pathways identified in the IPA analysis. (F) FeaturePlots displaying expression of cluster specific markers on the t‐SNE map along with violin plots showing the expression levels (y‐axis) of these markers for each cluster (x‐axis). Additional enriched genes are detailed in Figures S2–S9.
