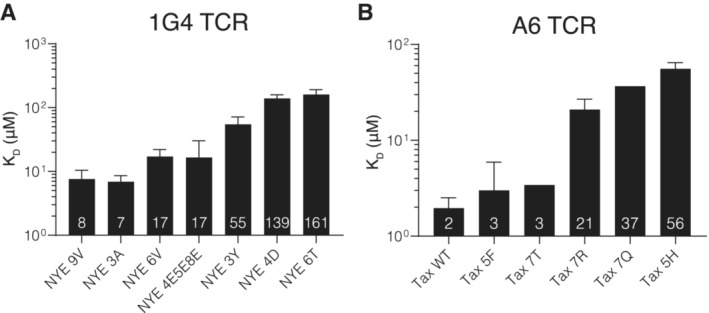
Figure EV1. Dissociation constants of TCR/pMHC bond measured by SPR.

- SPR dissociation constants for the 1G4 TCR (N = 2–10).
- SPR dissociation constants for the A6 TCR (N = 1–6).
Data information: Shown are geometric means with geo. SDs from the N independent experiments conducted on different days with the numbers in the bar indicating the geometric mean. Data is partially reproduced from Fig 1G and H of our previous measurements (Pettmann et al, 2021) with additional repeats and pMHC variants.
Source data are available online for this figure.
