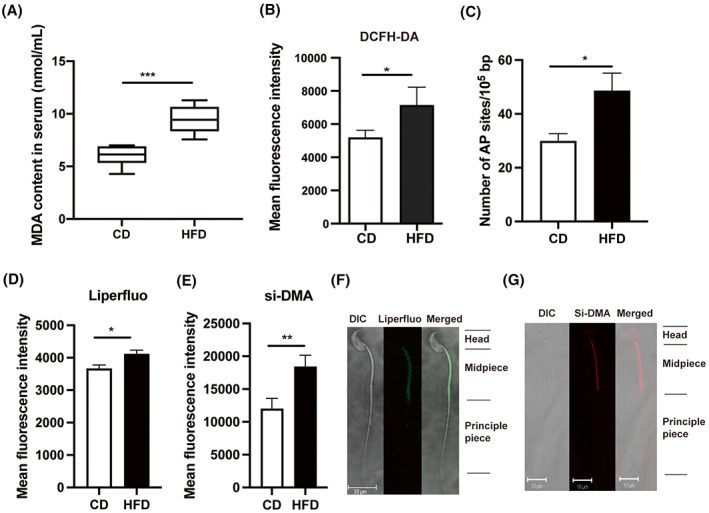
Fig. 3.

Oxidative stress‐induced changes in mouse serum and sperm. (A) The MDA content in serum from HFD mice was significantly higher than that in the CD group (n = 6). (B) ROS levels in mouse sperm were measured by fluorescent dye (DCFH‐DA). (C) DNA damage quantification in mouse sperm, AP sites: apurinic/apyrimidinic sites. (D, E) Comparisons of mean fluorescence intensity of Liperfluo and si‐DMA in mouse sperm between CD and HFD groups (n = 10). (F, G) Liperfluo and si‐DMA staining in mouse sperm were visualized by confocal fluorescence microscopy. Scale bars, 10 μm. Data are expressed as mean ± SD. Statistical analysis was performed using the Student's t‐test. *P < 0.05; **P < 0.01; ***P < 0.001. DCFH‐DA, 2′,7′‐dihydrochlorofluorescein diacetate; Liperfluo and si‐DMA, fluorescent probes for detecting lipid peroxidation and mitochondrial singlet oxygen, respectively; MDA, malondialdehyde.
