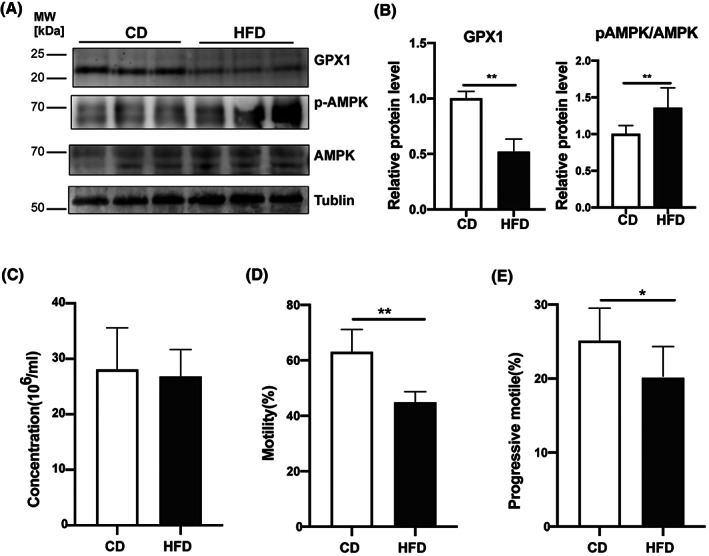
Fig. 5.

Sperm GPX1, AMPK, and p‐AMPK expressions and sperm parameters in mice. (A) Western blot analyses of protein expression levels of GPX 1, AMPK, and p‐AMPK (Thr‐172) in sperm from CD and HFD mice. Tubulin was used to validate protein loading equivalence simultaneously. (B) The quantification of protein bands in (A), shown as relative protein expression level (n = 8). (C–E) Comparison of sperm parameters in CD and HFD mice, including sperm concentration, motility, and progressive motility (n = 10). Data are expressed as mean ± SD. Statistical analysis was performed using the Student's t‐test. *P < 0.05; **P < 0.01. AMPK, adenosine 5′‐monophosphate‐activated protein kinase; GPX1, glutathione peroxidase 1; p‐AMPK, phosphorylation of AMP‐activated protein kinase.
