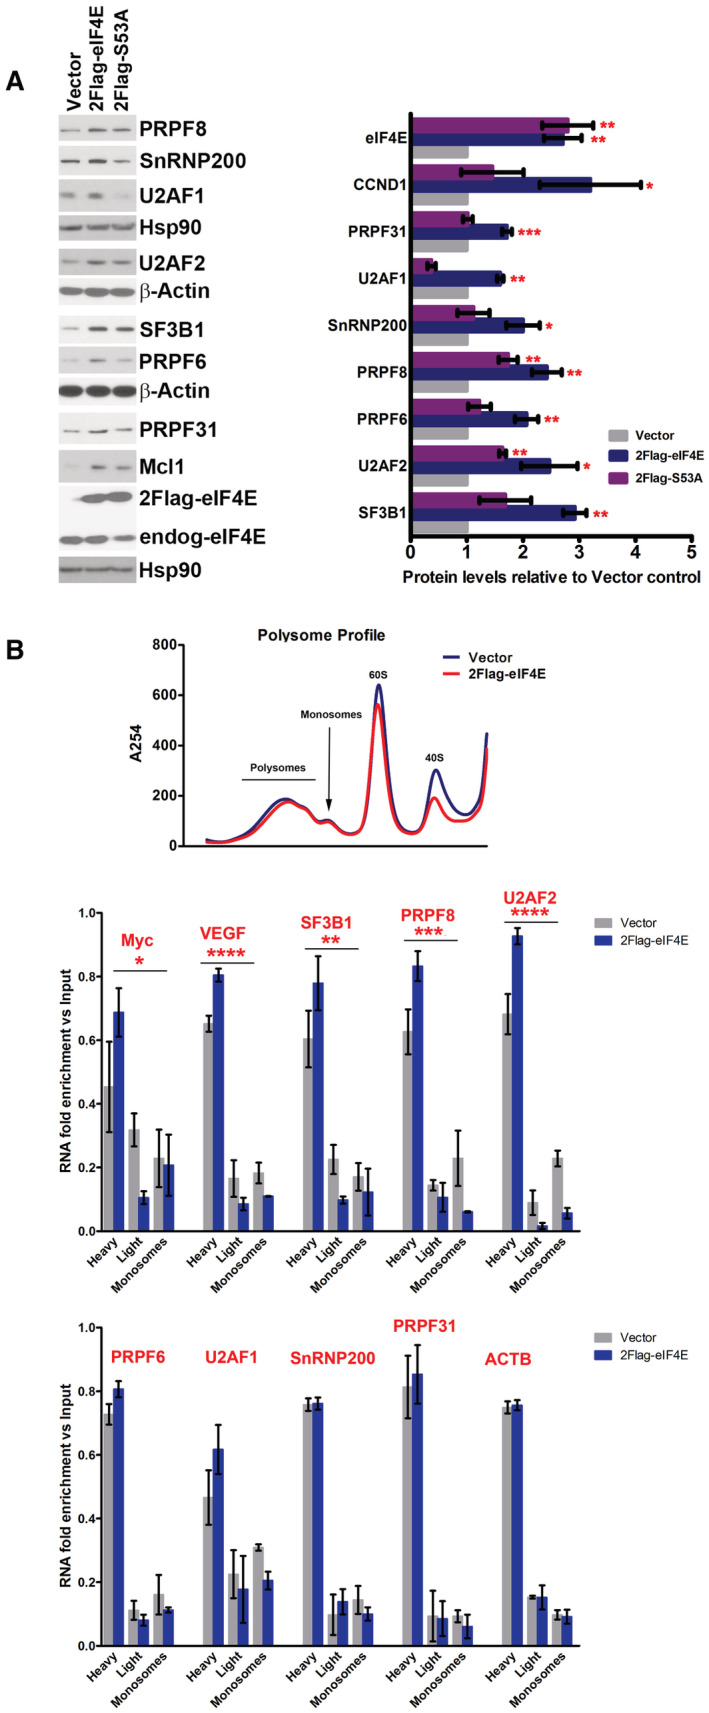
Figure 2. Analysis of the impacts of S53A eIF4E mutant on its capacity to alter the SF landscape and the role of translation for this activity.

- WB analysis of the impacts of S53A 2FLAG‐eIF4E (2Flag‐S53A) relative to WT 2FLAG‐eIF4E (2Flag‐eIF4E) on SF production. CCND1 served as positive controls and β‐actin or HSP90 as loading controls. Both 2FLAG‐eIF4E (2Flag‐eIF4E) and endogenous eIF4E (endog‐eIF4E) are shown. Each β‐actin or HSP90 blot corresponds to the above western blots. S53A eIF4E protein levels are indistinguishable from eIF4E. Experiments were carried out using three separate clones for eIF4E, S53A, and Vector controls, and one representative experiment is shown. (Right) Western blots were quantified by FIJI, and intensities normalized to Vector control and plotted using PRISM. The mean, standard deviation, and P‐values are shown. Student t‐test: *P < 0.05, **P < 0.01, ***P < 0.001.
- Polysomal loading analysis was measured to assess the relevance of eIF4E's capacity to increase translation efficiency on SF protein production. Top panel shows the polysomal profile (at 254 nm) demonstrating that 2FLAG‐eIF4E overexpression did not alter the profile relative to Vector controls, consistent with previous studies (Culjkovic‐Kraljacic et al, 2016, 2020a). Polysomes were isolated by size exclusion chromatography (SEC) and thus the heaviest polysomes elute first and monosomes last. (Middle and Bottom panels) RNAs were monitored on heavy, light, or monosome polysomes using RT–qPCR and presented as a fraction of the given RNA. Known translation targets of eIF4E, MYC, and VEGF were shifted to higher polysomes in eIF4E overexpressing cells and SF‐encoding RNAs with altered polysomes (middle) or those that were unchanged by eIF4E including the negative control ACTB are in the bottom panel (Culjkovic‐Kraljacic et al, 2016, 2020a). Experiments were carried out in biological duplicates using different clones, each carried out in technical triplicate. Means are shown and P‐values calculated using ANOVA (PRISM).
Data information: ANOVA test, *P < 0.05, **P < 0.01, ***P < 0.001, ****P < 0.0001.
