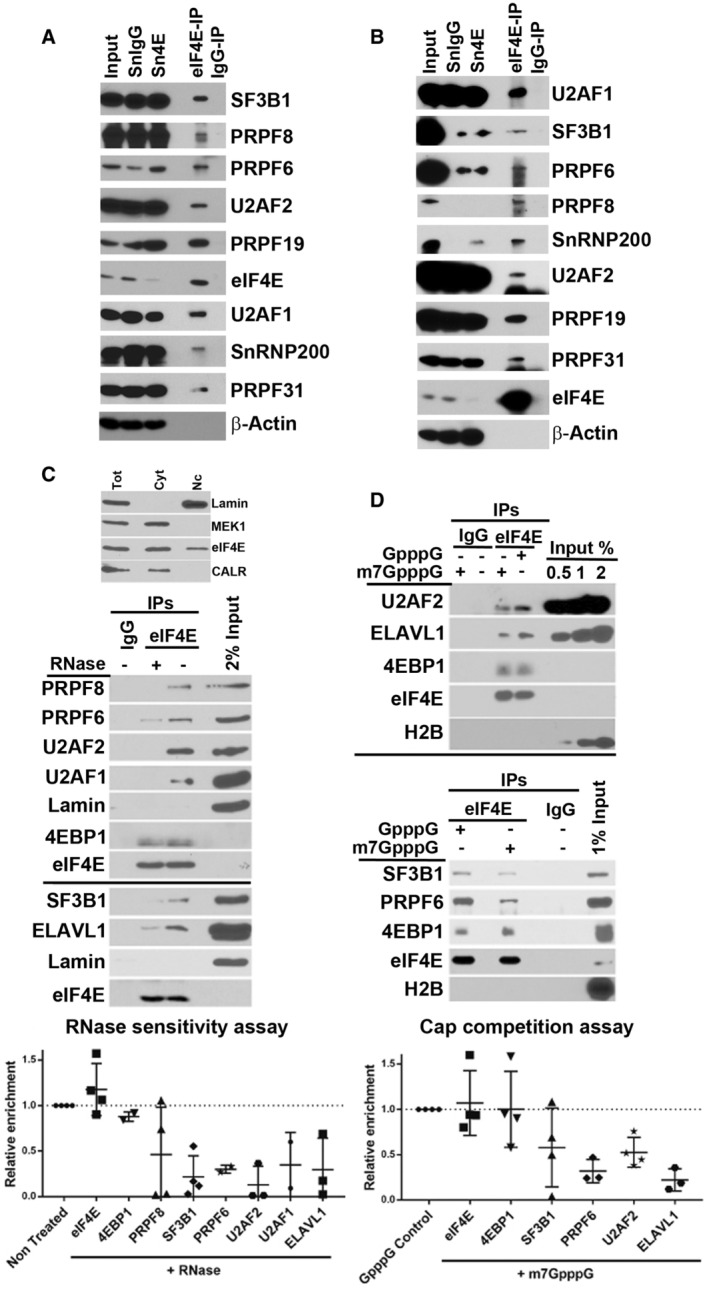
Figure 4. eIF4E physically interacts with the splicing machinery in an RNA and cap‐dependent manner.

- Endogenous eIF4E co‐immunoprecipitated with SFs in the nuclear fractions of U2OS cells. Immunoprecipitations (IP) were carried out using U2OS nuclear lysates and anti‐eIF4E antibody (eIF4E‐IP) or appropriate IgG control (IgG‐IP), carried out at least three independent times, and one representative experiment is shown. IP samples along with Input (2%) and supernatants (Sn) after IPs were analyzed by WB using antibodies as indicated.
- eIF4E co‐immunoprecipitated with SFs in the nuclear fractions of NOMO‐1 cells. IPs were carried out using eIF4E overexpressing NOMO‐1 nuclear lysates and anti‐eIF4E antibody (eIF4E‐IP) or appropriate IgG control (IgG‐IP). IP samples were analyzed by WB as above and carried out in three biological replicates.
- eIF4E interaction with splicing factors depends on the presence of RNAs in U2OS cells. The eIF4E‐IP was divided into two and treated with buffer or RNase. After elution, 2% of the nuclear extract and the IPs were resolved on SDS–PAGE and analyzed by WB with indicated antibodies. Representative gels of three biological replicates are shown (middle panel) and intensities measured using FIJI are shown in scatterplot (bottom panel) generated in PRISM with means depicted as horizontal lines and standard deviation as vertical lines. Each point represents an independent experiment. Fraction purity was assessed with the indicated antibodies (C top panel).
- eIF4E interaction with SF is cap‐dependent. eIF4E‐IPs were competed with m7GpppG and the negative control GpppG treatment in U2OS cells. Representative gels of three biological replicates are shown (top and middle panel), and quantification as in panel (C) (bottom panel) is shown.
Data information: (C, D) The number of independent experiments for each target is shown, which varies from n = 3 to 4 replicates. Error bars represent standard deviations (vertical line).
