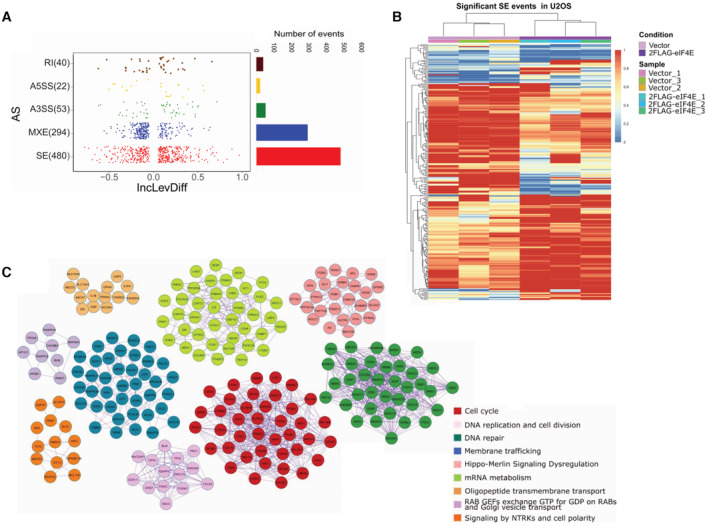
Figure 5. eIF4E overexpression drives widescale reprogramming of splicing.

- Left. Dot plot showing the distribution of Inclusion Level Differences (IncLevDiff) values (IncLev (2FLAG‐eIF4E) – IncLev (Vector)) for each splicing category. Right. Histogram showing the number of events for each splicing category.
- Splicing heatmap showing the values of IncLev for all the Skipping exon (SE) events between Vector (n = 3, biological replicates) and 2FLAG‐eIF4E (n = 3, biological replicates) U2OS cells. Other events are shown in Appendix Fig S3.
- Protein interaction networks identified for alternatively spliced genes. Pathway and process enrichment analysis was applied for each MCODE component, and the best‐scoring term by P‐value is shown.
