
Figure 2. Expression and localization of the mitochondrial matrix‐targeted fluorescent proteins.
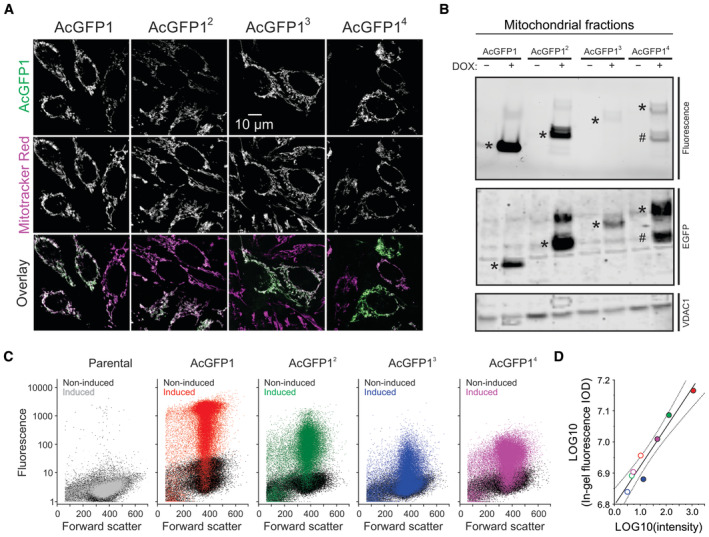
- Cellular localization of the four AcGFP1 concatemers (AcGFP1, AcGFP12, AcGFP13, AcGFP14) in HeLa cell lines cultured in the presence of the expression inducer doxycycline (DOX). Images were acquired by confocal microscopy and depict typical fluorescence signals of AcGFP1 (upper row), the mitochondrial marker Mitotracker Red CM‐H2XROS (middle row), and an overlay of these signals (lower row; AcGFP1 in green; Mitotracker Red CM‐H2XROS in magenta; colocalization in white).
- Analysis of FP expression and concatemer integrity in mitochondrial fractions isolated from HeLa cells cultured in the absence (−) and presence (+) of DOX. The panels display AcGFP1 fluorescence (SDS–PAGE fluorogram; upper panel), AcGFP1 protein signals (SDS–PAGE; anti‐EGFP immunodetection; middle panel) and VDAC1 protein signals (SDS–PAGE; loading control; lower panel). Bands for AcGFP1, AcGFP12, AcGFP3 and AcGFP14 are marked by asterisks (*). For AcGFP14, also a substantial band of lower MW was detected (marked #). Individual panels were contrast‐optimized for visualization purposes. Original blots are presented in Appendix Fig S1A.
- Flow cytometry analysis of the parental and FP‐expressing HeLa cell lines. Fluorescence intensity is plotted against forward scatter. The noninduced condition (i.e., in absence of DOX) is depicted by black symbols. The effects of DOX are marked in gray (parental cells) and various colors (FP‐expressing cells). For AcGFP1, AcGFP12 (noninduced), AcGFP13 and AcGFP14 a total of n = 40,000 cells from four technical replicates were analyzed on a single day (N = 1). For the AcGFP12‐induced condition n = 30,000 cells from three technical replicates are depicted (N = 1).
- Correlation between the average AcGFP1 fluorescence intensity in panel (C) (x‐axis) and the integrated optical density (IOD; y‐axis) for each condition (full lane) in panel (B) (in‐gel fluorescence signal; the original gel was used for quantification). Noninduced cells are marked by open symbols; induced cells are marked with colored symbols (similar to panel C). The continuous line represents a linear fit to the data (R = 0.966; P < 0.0001). Dotted lines indicate the 95% confidence limits of the fit.