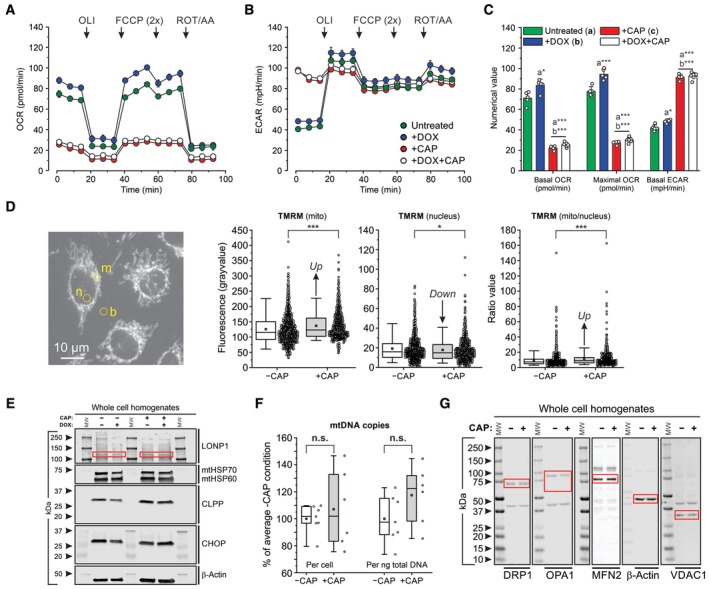
Figure EV2. Functional consequences of chloramphenicol (CAP) treatment in HeLa parental cells.

- Average oxygen consumption rate (OCR) in untreated cells, and cells treated with DOX, CAP, or DOX + CAP (for legend see panel B). Oligomycin (OLI), mitochondrial uncoupler (FCCP), and antimycin A + rotenone (AA/ROT) were added at the indicated time points.
- Same as panel (A) but now for the average extracellular acidification rate (ECAR).
- Statistical analysis of the data in panel (A and B) with respect to the basal OCR, maximal OCR and basal ECAR.
- Effect of CAP on the TMRM fluorescence signal in mitochondria and nucleus. Left panel: Typical example of fluorescence microscopy image of TMRM‐stained cells. Fluorescence signals were manually determined in two regions of interest (yellow) defined in a mitochondria‐dense (“m”) and nucleoplasmic part (“n”) of the cell and corrected for background using a close by ROI outside of the cell (“b”). Data panels: numerical values for the mitochondrial fluorescence signal (mito), nuclear fluorescence signal (nucleus) and fluorescence ratio value (mito/nucleus).
- Effect of DOX, CAP or DOX + CAP on the cellular protein levels of LONP1 (specific bands marked by red boxes), mtHSP70, mtHSP60, CLPP and CHOP. β‐actin was used as cellular loading control. Arrowheads indicate molecular weight in kDa. Individual panels were contrast‐optimized for visualization purposes. Original blots are presented in Appendix Fig S5B.
- Effect of CAP on mitochondrial DNA (mtDNA) levels expressed as number of mtDNA copies per cell and per nanogram (ng) of total DNA.
- Effect of CAP on the cellular levels of key mitochondrial fission and fusion proteins (specific bands are marked by red boxes): DRP1 (Dynamin‐related protein 1, OPA1 (Optic atrophy protein 1), MFN2 (Mitofusin 2). β‐actin and VDAC1 were used as cellular and mitochondrial loading controls, respectively. Arrowheads indicate molecular weight in kDa. Individual panels were contrast‐optimized for visualization purposes. Original blots are presented in Appendix Fig S5A.
Data information: OCR and ECAR data (panels A–C) was obtained in a single (N = 1) experiment and the following number (n) of technical replicates: Untreated (n = 5), +DOX (n = 5), +CAP (n = 4), +DOX+CAP (n = 6). TMRM data (Panel D) was obtained in N = 2 independent experiments for n = 991 cells (−CAP) and n = 668 cells (+CAP). MtDNA data (panel F) was obtained in N = 2 independent experiments in n = 7 assays (−CAP) and n = 6 assays (+CAP). Each symbol represents an individual well (panel C), cell (panel D) or assay (panel F). In panels (A and B), individual data points reflect mean ± SEM. In panel (C), bars and errors reflect mean ± SEM. In panels (D and F), error bars mark the 95% (upper) and 5% (lower) percentile, the boundary boxes mark the 75% (upper) and 25% (lower) percentile, the square marks the mean value of the data, and the horizontal line within the box indicates the median value of the data. Significant differences, obtained using an independent Student's t‐test, are indicated by *P < 0.05, **P < 0.01, ***P < 0.001 between the marked conditions (a–c) in panel (C) and between the −CAP and +CAP condition (panel D and F). Not significant is marked by n.s. The exact P‐values for panel (C) (basal OCR) were: Untreated (a) vs. +DOX (b): P = 0.0126; Untreated (a) vs. +CAP (c): P = 1.554·10−6; Untreated (a) vs. +DOX+CAP: P = 4.082·10−8; +DOX (b) vs. +CAP (c): P = 2.671·10−7; +DOX (b) vs. +DOX + CAP: P = 3.806·10−9. The exact P‐values for panel (C) (maximal OCR) were: Untreated (a) vs. +DOX (b): P = 6.509·10−4; Untreated (a) vs. +CAP (c): P = 2.019·10−7; Untreated (a) vs. +DOX+CAP: P = 4.900·10−9; +DOX (b) vs. +CAP (c): P = 4.558·10−8; +DOX (b) vs. +DOX + CAP: P = 5.713·10−10. The exact P‐values for panel (C) (basal ECAR) were: Untreated (a) vs. +DOX (b): P = 0.0023; Untreated (a) vs. +CAP (c): P = 4.571·10−8; Untreated (a) vs. +DOX+CAP: P = 7.784·10−10; +DOX (b) vs. +CAP (c): P = 2.412·10−8; +DOX (b) vs. +DOX+CAP: P = 7.039·10−10. The exact P‐value for panel (C) (mito) was: P = 7.145·10−6. The exact P‐value for panel (C) (nucleus) was: P = 0.0237. The exact P‐value for panel (C) (mito/nucleus) was: P = 5.702·10–5. The exact P‐value for panel (F) (per cell) was: P = 0.556. The exact P‐value for panel (F) (per ng total DNA) was: P = 0.139.
