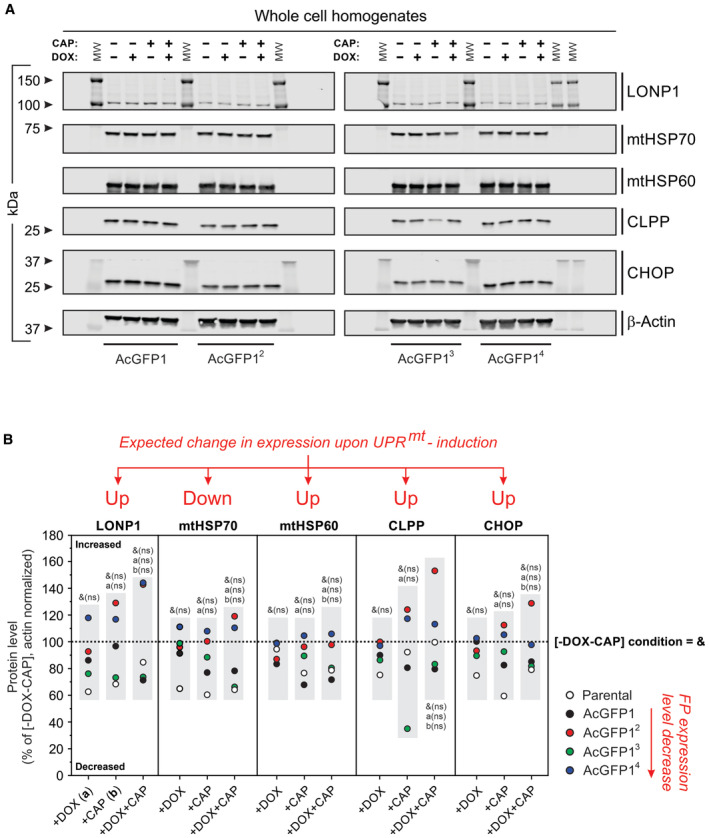
Figure EV3. Chloramphenicol (CAP) and doxycycline (DOX) do not increase protein markers typically associated with induction of the mitochondrial unfolded protein response (UPRmt) in parental and FP‐expressing cells.

- Western blot analysis (SDS–PAGE) of whole‐cell homogenates was used to assess the levels of the following proteins: LONP1, mtHSP70, mtHSP60, CLPP, and CHOP. β‐actin was used as a cellular loading control. MW indicates molecular weight in kDa. Effect of the expression inducer DOX (1 μg/ml, 24 h) and CAP (40 μg/ml, 72 h), alone and in combination (i.e., 48‐h CAP treatment followed by 24 h CAP + DOX treatment), on protein levels in FP‐expressing HeLa cell lines (AcGFP1, AcGFP12, AcGFP13, and AcGFP14). Individual panels were contrast‐optimized for visualization purposes. Original blots are presented in Appendix Fig S4.
- Quantitative analysis of protein levels in panel A and in HeLa parental cells (the open symbols reflect data for the parental cells in Appendix Fig S5B). All signals were normalized on β‐actin and expressed as % of the condition without DOX and CAP (“−DOX−CAP”). Effects previously associated with UPRmt induction are marked: “Up” indicates proteins that are expected to be upregulated upon UPRmt induction, “Down “indicates proteins that are expected to be downregulated upon UPRmt induction.
Data information: The effects of DOX, CAP, and DOX + CAP were compared with the “−DOX−CAP” (untreated) condition (i.e., with the dotted line marked “&”) by testing whether the mean value for each protein (i.e., within each gray box in panel B) differed from 100% (using a one‐sample Student's t‐test). Comparisons with the DOX only condition (+DOX; marked “a”) and CAP‐only condition (+CAP; marked “b”) were performed using an independent two‐population t‐test (i.e., between each gray box for each protein). Not significant is marked by n.s.
