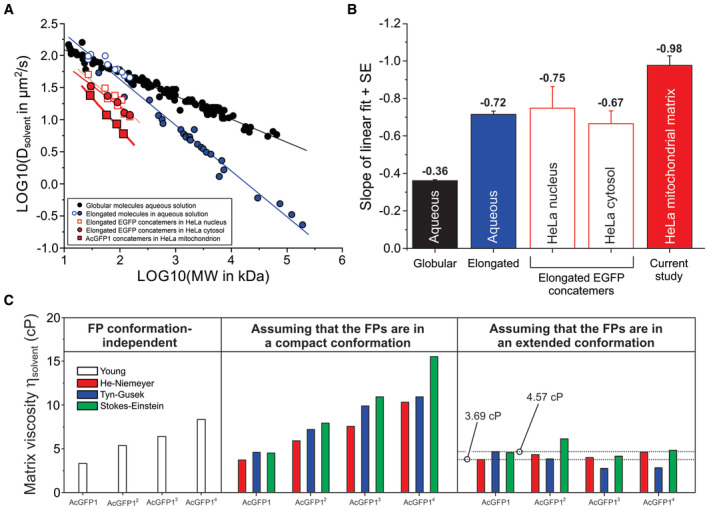
Figure 4. Relationship between Dsolvent and MW for the mitochondrial matrix‐targeted fluorescent proteins, viscosity analysis and protein structure prediction.

- Linear relationship between experimental Dsolvent and MW values for various biomolecules in a double logarithmic plot. Data obtained in aqueous solution is separated into globular biomolecules (filled black symbols; continuous black line), elongated EGFP concatemers (open blue symbols; continuous blue line) and elongated biomolecules (filled blue symbols; continuous blue line). Red symbols reflect intracellular diffusion measurements with EGFP concatemers in HeLa cell nuclei (open red squares; dotted red line), EGFP concatemers in HeLa cytosol (filled red circles; continuous thin red line) and AcGFP1 concatemers in the mitochondrial matrix (filled red squares; continuous thick red line; current study). Full numerical data, fitting parameters using (LOG10 (Dsolvent) = A + B·LOG10 (MW) and background information are provided in Appendix Tables S2 and S3.
- Slopes of the linear fits depicted in panel (A) for the different classes of biomolecules measured in aqueous solution and intracellular compartments. Individual bars reflect mean ± SE (standard error) values from the linear fit.
- The viscosity of the mitochondrial matrix solvent (ηsolvent) was calculated from the Dsolvent values of the FPs using four empirical equations (Young, He–Niemeyer, Tyn–Gusek and Stokes–Einstein). This allowed the prediction of ηsolvent as well as FP structural conformation (“compact” or “extended”; Fig EV1). The estimated ηsolvent ranged between 3.69 and 4.57 cP. See Results for details.
