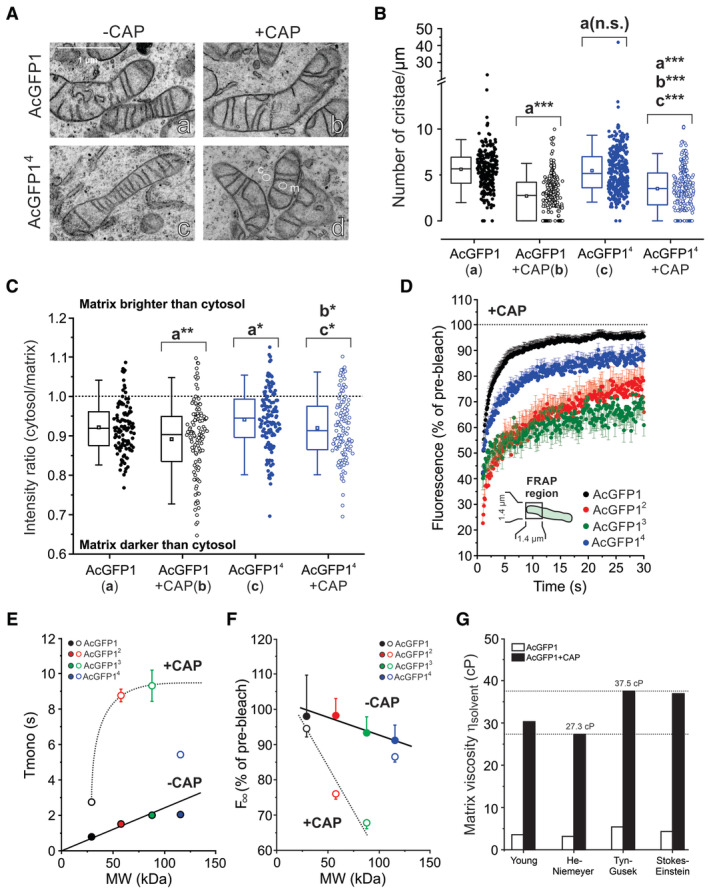
Figure 5. Chloramphenicol decreases the number of cristae, increases matrix electron density, reduces the mobility of mitochondrial matrix‐targeted fluorescent proteins and increases matrix viscosity.

- Transmission electron microscopy (EM) images of AcGFP1 and AcGFP14‐expressing HeLa cells cultured in the absence and the presence of chloramphenicol (CAP). Images were contrast‐optimized to better visualize cristae. Cytosolic and mitochondrial regions of interest typically used for electron density analysis (panel C) are marked by “c” and “m,” respectively.
- Effect of CAP on the average number of cristae/μm calculated by dividing the number of cristae by the mitochondrial length for individual mitochondria. Data was obtained in N = 2 independent EM experiments for n = 244 mitochondria (AcGFP1), n = 295 (AcGFP1 + CAP), n = 314 (AcGFP14) and n = 259 (AcGFP14 + CAP).
- Effect of CAP on the electron density of the mitochondrial matrix quantified from EM images (original images were used). The y‐axis depicts the intensity ratio between a cytosolic region of interest (ROI; e.g., panel A‐d, marked “c”) and a close by ROI in the mitochondrial matrix (e.g., panel A‐d, marked “m”). Equal intensities of these ROIs are marked by the dotted line. Only mitochondria with clearly visible cristae (i.e., that were fully within the EM section) were included (N = 2 independent experiments) from n = 112 mitochondria (AcGFP1), n = 119 (AcGFP1 + CAP), n = 134 (AcGFP14) and n = 116 (AcGFP14 + CAP).
- Average FRAP curves (mean ± SEM) for mitochondrial matrix‐targeted FPs in the presence of CAP (Table 1). Data was obtained in at least N = 3 independent experiments for n = 40 mitochondria (AcGFP1 + CAP), n = 24 (AcGFP12 + CAP), n = 26 (AcGFP13 + CAP) and n = 33 (AcGFP14 + CAP).
- Relationship between MW and Tmono in the absence of CAP (−CAP; data taken from Fig 3B) and in the presence of CAP (+CAP; curve manually drawn). Symbols and error bars reflect mean ± SE (standard error) values from the mono‐exponential fit. For data points without error bar, the latter fell within the size of the symbol.
- Same as panel (E) but now for the relationship between MW and the fluorescence intensity (F∞) of the FPs by extrapolating the fitted exponential recovery to t = t∞ (lines manually drawn). Symbols and error bars for F∞ reflect mean ± SEM and were computed from the mono‐exponential fit parameters as described in Table 1.
- Impact of CAP on the solvent‐dependent viscosity (ηsolvent) of the mitochondrial matrix fluid determined using the Dsolvent values of AcGFP1 (see Results for details). The estimated ηsolvent ranged between 27.3 and 37.5 cP.
Data information: In panels (B and C) each symbol represents an individual mitochondrion, error bars mark the 95% (upper) and 5% (lower) percentile, the boundary boxes mark the 75% (upper) and 25% (lower) percentile, the square marks the mean value of the data, and the horizontal line within the box indicates the median value of the data. Data in panel (B and C) was compared using an independent Student's t‐test and significant differences are indicated by *P < 0.05, **P < 0.01, ***P < 0.001 between the marked conditions (a–c). Not significant is marked by n.s. The exact P‐values for panel (B) were: AcGFP1 (a) vs. AcGFP1 + CAP (b): P = 1.894·10−40; AcGFP1 (a) vs. AcGFP14 + CAP: P = 1.458·10−21; AcGFP1 + CAP (b) vs. AcGFP14 + CAP: P = 4.846·10−5; AcGFP14 (c) vs. AcGFP14 + CAP: P = 2.725·10−16. The exact P‐values for panel (C) were: AcGFP1 (a) vs. AcGFP1 + CAP (b): P = 0.00545; AcGFP1 (a) vs. AcGFP14 (c): P = 0.0348; AcGFP1 + CAP (b) vs. AcGFP14 + CAP: P = 0.0142; AcGFP14 (c) vs. AcGFP14 + CAP: P = 0.0366.
