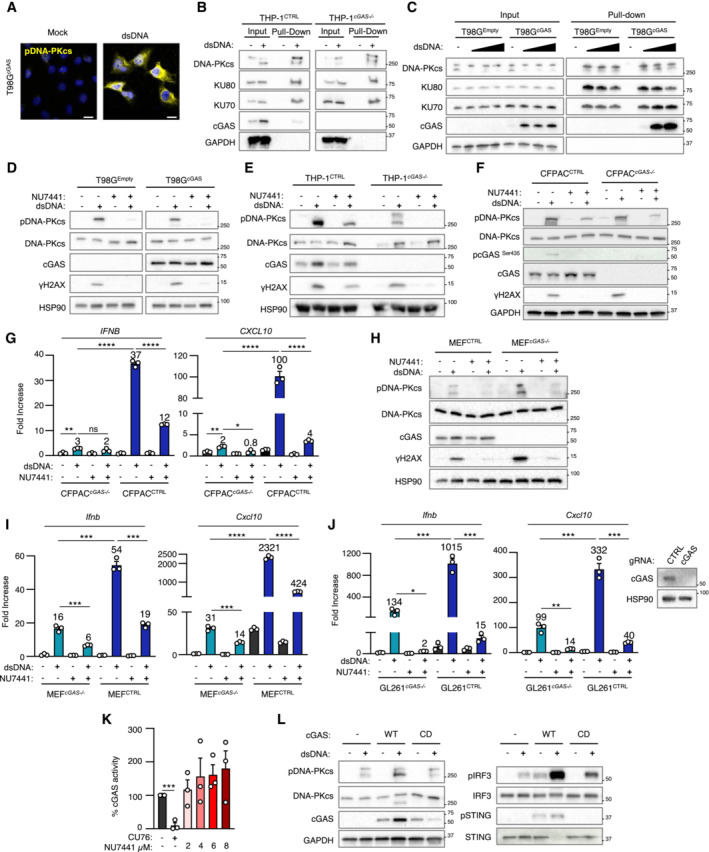
Figure EV3. DNA‐PKcs and cGAS synergize for the activation of type I Interferon responses.

- T98G cells expressing a cGAS‐encoding vector (T98GcGAS) were treated or not with dsDNA for 6 h prior to IF analysis using pDNA‐PKcs‐specific antibody and DAPI nuclear staining (n = 3 independent experiments). Scale bar, 20 μm.
- THP‐1 and THP‐1 cGAS −/− were transfected or not with 80‐nt long biotinylated dsDNA prior to whole cell extraction and pull‐down using streptavidin‐affinity beads. Inputs and eluates were analyzed by WB using indicated antibodies.
- T98G cells expressing an empty (T98GEmpty) or T98GcGAS were transfected or not with 5, 10 or 20 μg of biotinylated dsDNA prior to whole cell extraction and pull‐down using streptavidin‐affinity beads. Inputs and eluates were analyzed by WB using indicated antibodies.
- T98GEmpty or T98GcGAS were transfected or not with dsDNA for 6 h in the presence or not of the NU7441 DNA‐PKcs inhibitor. Whole cell extracts were analyzed by WB using indicated antibodies.
- THP‐1CTRL and THP‐1 cGAS −/− were transfected or not with dsDNA for 6 h in presence or not of the NU7441 DNA‐PKcs inhibitor prior to analysis of protein expression by WB using indicated antibodies.
- CFPAC and CFPAC cGAS −/− were transfected or not with dsDNA for 6 h in presence or not of the NU7441 DNA‐PKcs inhibitor prior to WB analysis using indicated antibodies.
- IFNB and CXCL10 mRNA levels were assessed by RT–qPCR in CFPACCTRL and CFPAC cGAS −/− treated as in D. Graphs present a representative biological triplicate (n = 3 independent experiments).
- As in (F), except that MEF and MEF cGas −/− were transfected.
- As in (G), except that MEF and MEF cGas −/− were transfected. Graphs present a representative biological triplicate (n = 3 independent experiments).
- GL261CTRL and GL261 cGAS −/− were transfected or not with dsDNA for 6 h in presence or not of the NU7441 DNA‐PKcs inhibitor. Whole cell extracts were analyzed by WB using indicated antibodies. IFNB and CXCL10 mRNA levels were assessed by RT–qPCR. Graphs present a representative biological triplicate (n = 3 independent experiments).
- cGAS activity upon treatment with 2.5 μM of the CU76 cGAS inhibitor and 2, 4, 6, or 8 μM of NU7441 was measured by ELISA (n = 3 independent experiments).
- T98GEmpty, T98GcGAS and T98GcGAS‐CD were transfected or not with dsDNA for 6 h prior to analysis of protein expression by WB using indicated antibodies.
Data information: All graphs present means ± SEM. All immunoblots show representative experiments (n = 3 independent experiments). P‐values were determined by Student's t‐test. ns: not significant. *P < 0.05, **P < 0.01, ***P < 0.001, ****P < 0.0001.
Source data are available online for this figure.
