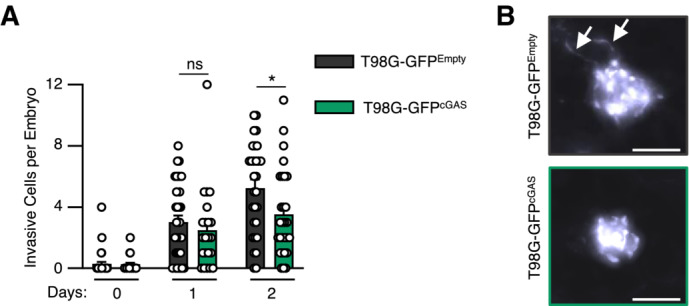
Figure EV4. Re‐expression of cGAS in glioblastoma cells decrease invasiveness in vivo .

- The number of invasive cells per embryo transplanted in Fig 4G was manually counted at D0, D1 and D2 post transplantation. Data represents mean (± SEM) of n = 21 (T98G‐GFPEmpty) or 29 (T98G‐GFPcGAS) embryos. A Mann–Whitney test was performed to assess the significance *P < 0.05.
- Representative images of elongated T98G cells counted in (A). Scale bar, 100 μm. Arrows indicate elongated pseudopodia.
