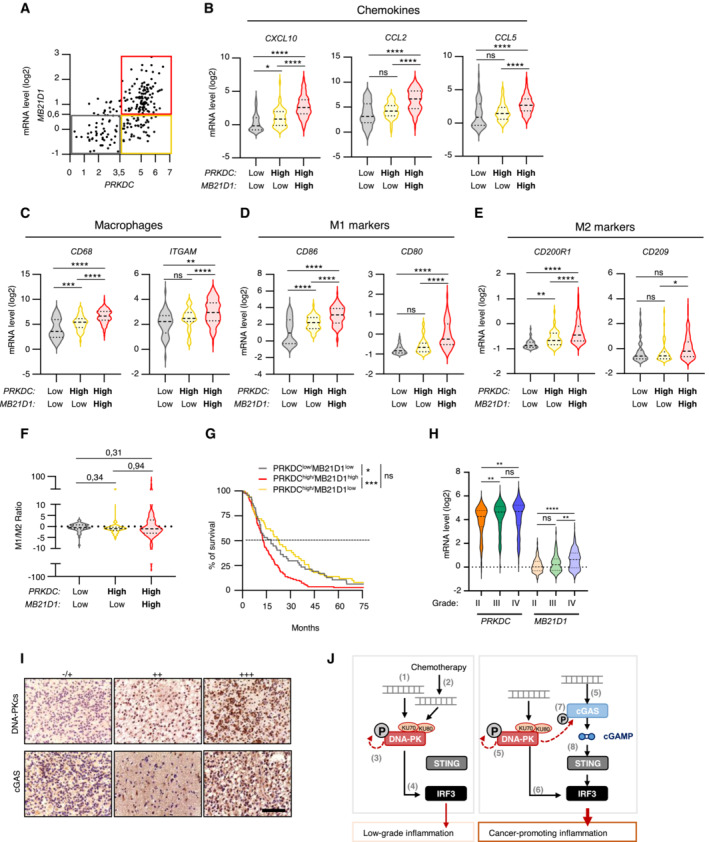
Figure 6. cGAS and DNA‐PKcs levels increase with tumor grade.

- Correlation plot between PRKDC and MD21B1 expression in glioblastoma patients. Three distinct populations can be visualized: PRKDC low /MD21B1 low ; PRKDC high /MD21B1 low and PRKDC high /MD21B1 high (total patients n = 224).
- Violin plots present chemokine gene expression (CXCL10, CCL2 and CCL5) in glioblastoma samples from (A).
- Violin plots present macrophage gene expression (CD68 and ITGAM) in glioblastoma samples from (A).
- Violin plots present pro‐inflammatory M1 macrophage gene expression (CD86 and CD80) in glioblastoma samples from (A).
- Violin plots present anti‐inflammatory M2 macrophages gene expression (CD200R1 and CD209) in glioblastoma samples from (A).
- Violin plots present M1/M2 gene expression ratio, calculated using the mean expression of the genes indicated in (D) and (E).
- Graph presents the survival rate of glioblastoma patients from A that present PRKDC low /MB21D1 low , PRKDC high /MB21D1 low and PRKDC high /MB21D1 high expression.
- Violin plots present the expression of PRKDC and MB21D1 in datasets analyzed in A, based on tumor grade (II to IV).
- Representative images of immunohistochemical analysis of DNA‐PKcs and cGAS proteins in human brain tumor samples. Scale bar, 75 μm.
- Schematic representation of the molecular mechanisms involved in the cooperation between DNA‐PKcs and cGAS for type I IFN responses and chemokine secretion. In cells with undetectable cGAS levels, interaction with exogenous (1) or endogenous (2) cytosolic dsDNA leads to DNA‐PK activation (3) and promotes IRF3‐dependent type I IFN responses (4). In cells where both DNA‐PK and cGAS are expressed, cytosolic DNA is detected by both DNA‐PK and cGAS (5). DNA‐PK induces cytokine and chemokine secretion through IRF3 activation and enables cGAS phosphorylation, thus promoting the activation of the cGAS‐STING pathway. This cooperation fuels cancer‐associated inflammation.
Data information: All graphs present means ± SEM. P‐values were determined by Student's t‐test. ns: not significant. *P < 0.05, **P < 0.01, ***P < 0.001, ****P < 0.0001. One‐way Anova with Tukey's multiple comparisons test was used to compare gene expression among populations in glioblastoma dataset.
Source data are available online for this figure.
