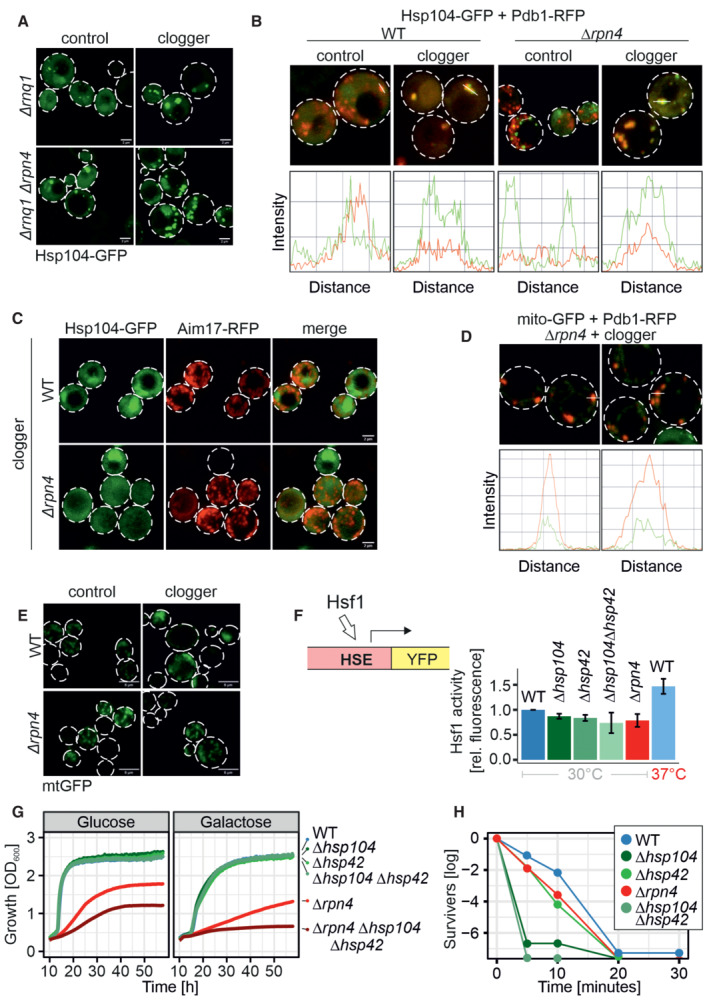
Figure EV5. MitoStore formation depends on the Hsp42/Hsp104 chaperone system.

- Microscopy of Δrnq1 and Δrpn4Δrnq1 cells expressing Hsp104‐GFP constitutively and the clogger or cytosolic control for 4.5 h. Please note that the formation of MitoStores did not depend on the yeast prion protein Rnq1. Scale bars, 2 μm.
- Quantification of the colocalization of Hsp104‐GFP with Pdb1‐RFP after clogger expression for 4.5 h.
- After 4.5 h of clogger and Aim17‐RFP expression, WT and Δrpn4 cells were incubated for 4 h in the absence of galactose. Whereas Hsp104‐GFP was distributed throughout the cytosol after this chase period, Aim17‐RFP showed a distribution pattern characteristic of mitochondrial proteins.
- Quantification of the colocalization of mito‐GFP with Pdb1‐RFP after clogger expression for 4.5 h in the Δrpn4 mutant.
- Cells expressing mitochondria‐targeted GFP (mtGFP) were grown in lactate medium containing 0.5% galactose for 4.5 h and visualized. Whereas Δrpn4 cell mtGFP shows a typical mitochondrial staining even upon clogger expression, the fluorescence in the clogger‐expressing wild‐type cells is more patchy and less defined. Scale bars, 5 μm.
- Expression of a heat shock response reporter that uses a YFP cassette expressed under the control of a heat shock element in the different strains indicated (Zheng et al, 2016; Boos et al, 2019). Cells were grown in lactate containing medium. Note that induction to 37°C activated the heat shock promoter, but the deletion of Hsp42, Hsp104, or Rpn4 under the nonchallenged conditions of the experiment did not. Data are displayed as mean ± standard deviations from n = 3 independent biological replicates.
- Cells of the indicated strains were grown to log phase and diluted in glucose or galactose medium to 0.1 OD600. Growth was monitored upon constant agitation at 37°C, respectively.
- Cells were grown in lactate to mid‐log phase before 50°C heat stress was performed for the indicated time points. After each time aliquots were removed, and the number of living cells was assessed by a plating assay.
Source data are available online for this figure.
