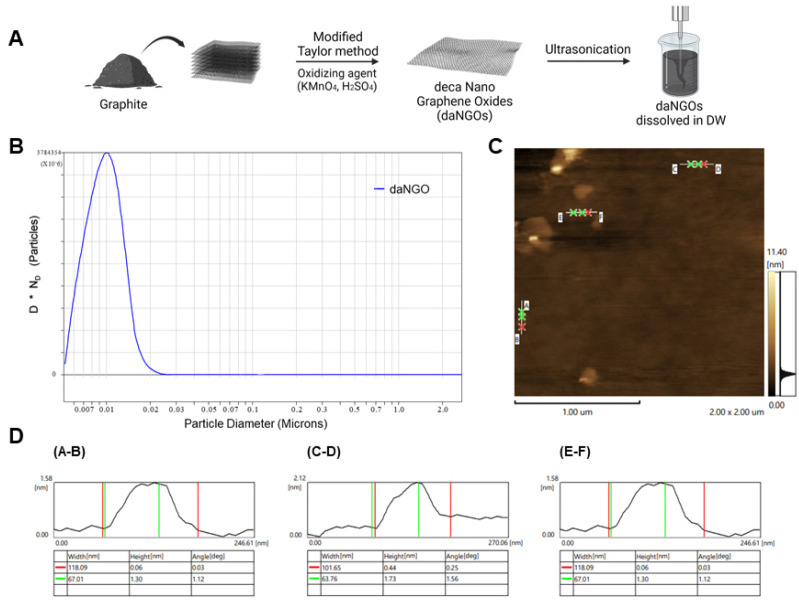
Fig. 1.
Preparation and characterization of daNGOs. (A) Scheme for the preparation of daNGOs. (B) The distribution of the daNGO diameters was measured using a particle size analyzer (PSA). The following particle size distributions were observed: 99% larger than 0.0055 μm, 90% larger than 0.0066 μm, 50% larger than 0.0096 μm, 10% larger than 0.0136 μm and 1% larger than 0.0182 μm. According to CPS analysis, the highest peak was 0.0101 μm (number of particles = 2.8 × 10¹²). (C) A 4 μμ2 AFM image showing three daNGO spots. (D) Data from the AFM image. The A-B point indicates a height of 1.3 nm (green) and a width of 118.09 nm (red).

