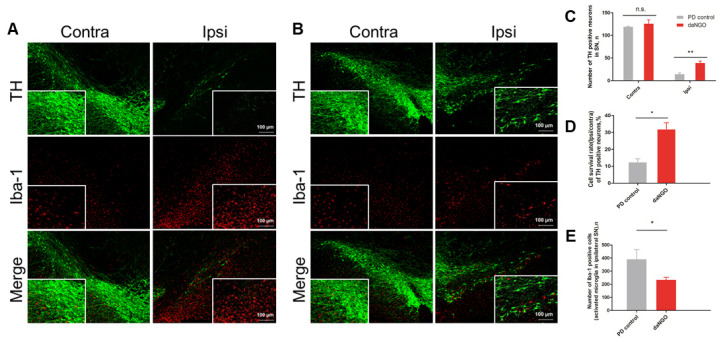
Fig. 4.
Confocal images of tyrosine hydroxylase (TH) and Iba-1 immunofluorescence in the rat SN. (A) PD control group. (B) daNGO group. Original magnification, 100×. (C) Quantification of the number of TH-positive cells. (D) The number of TH positive cells was expressed as a cell survival rate (ipsi/contra). (E) Quantification of the number of activated microglia in the ipsilateral SN; **P < 0.01 and *P < 0.05.

