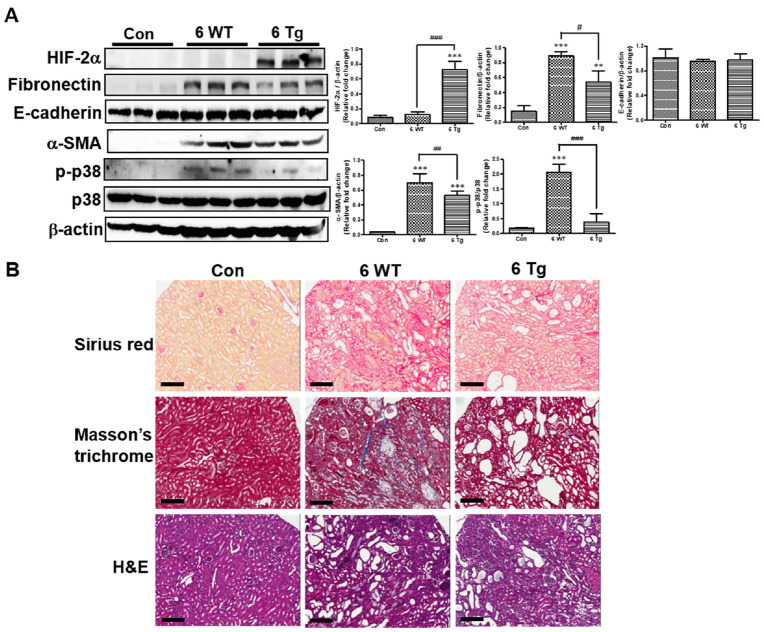
Fig. 2.
Effects of long-term HIF-2α activation on renal fibrosis in the CKD model. (A) HIF-2α, fibronectin, E-cadherin, α-smooth muscle actin (α-SMA), and phosphorylated-p38 (p-p38) protein levels in the kidneys of standard diet-fed control mice and 6-week DOX + 0.2% adenine diet-fed WT and Tg mice were determined using western blotting (left panel). Band intensities in the western blot were quantitated by computerized densitometry blotting (right panel). *P < 0.05, **P < 0.01, and ***P < 0.001 compared to the controls; #P < 0.05 between the two groups. (B) Representative kidney sections from the same mice as in (A) stained with Sirius Red, Masson’s trichrome, and hematoxylin and eosin (H&E). Scale bar, 20 μm.

