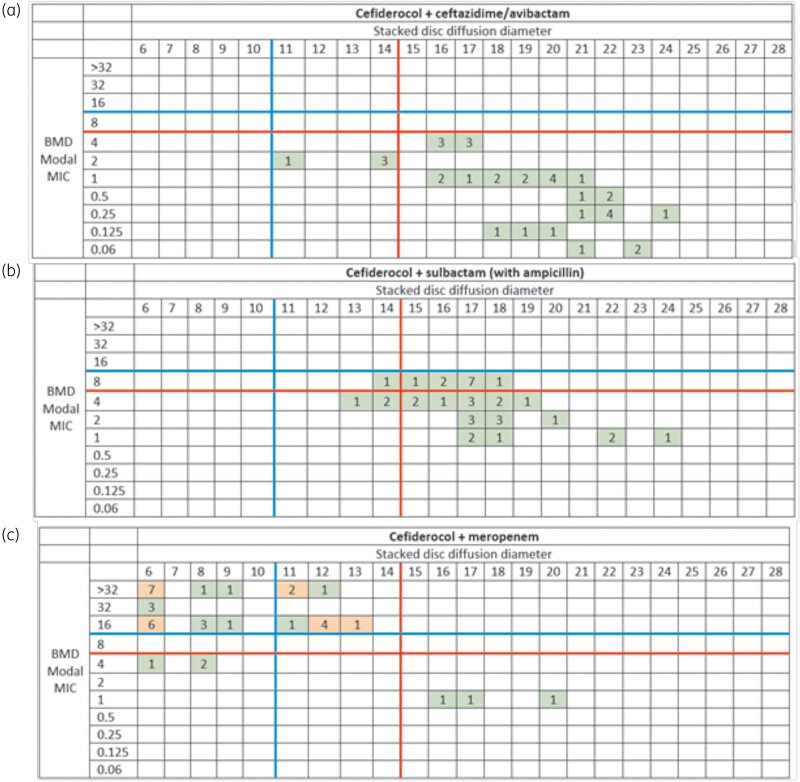
Figure 3.
Distribution of the zone diameter of disc stacking of (a) cefiderocol + ceftazidime/avibactam, (b) cefiderocol + ampicillin/sulbactam and (c) cefiderocol + meropenem compared to the modal broth microdilution MIC of each respective combination. All disc diffusion zones are in at least three replicates per isolate. The red line corresponds to cefiderocol susceptibility per CLSI (BMD ≤ 4 mg/L, DD ≥ 15 mm). The blue line signifies cefiderocol intermediate per CLSI (BMD = 8 mg/L, DD = 11–14 mm). Green boxes indicate that >1-log10 reduction in cfu/thigh was observed in all isolates in each category. An orange box indicates at least one isolate in the category did not demonstrate >1-log10 reduction in cfu/thigh or was no better than cefiderocol alone. BMD = broth microdilution, DD = disc diffusion.

