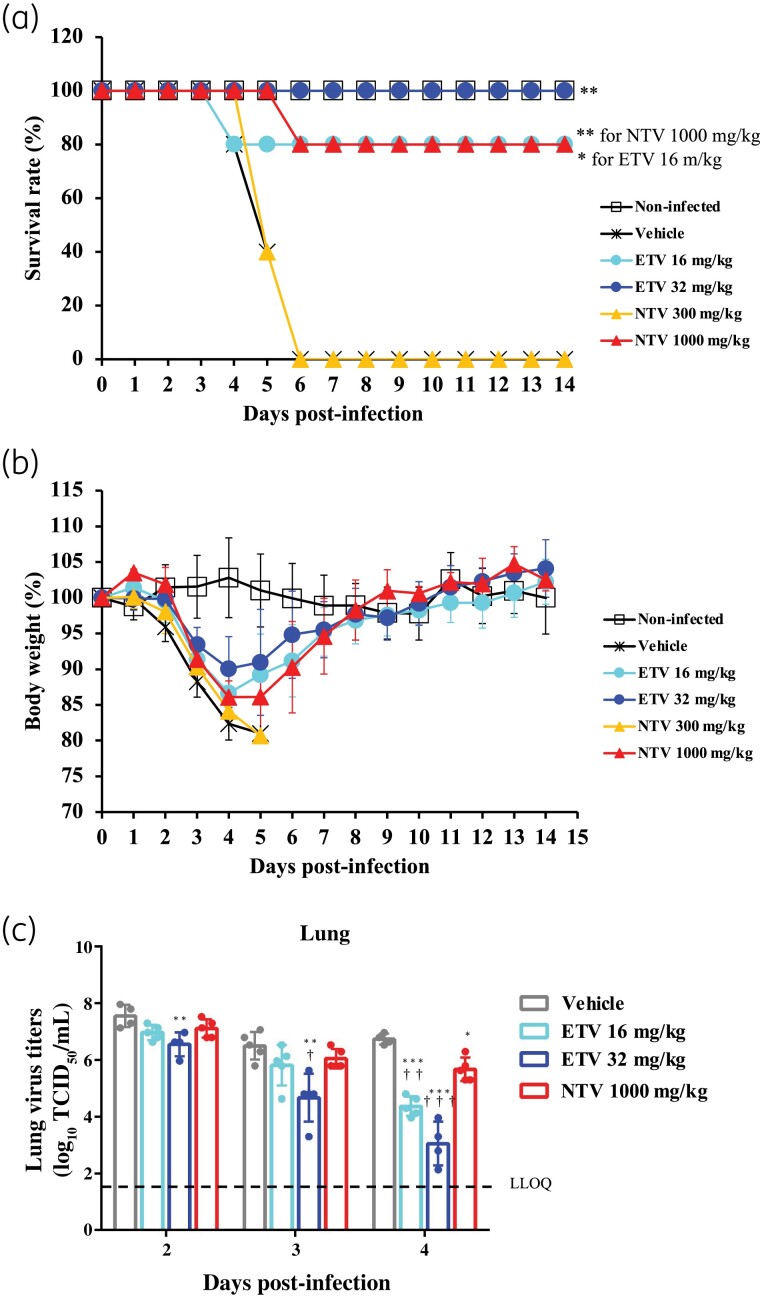
Figure 1.
In vivo efficacy of ensitrelvir compared with that of nirmatrelvir in a mouse lethality model. Female BALB/cAJcl mice were nasally infected with the mouse-adapted SARS-CoV-2 (MA-P10) strain and then orally administered various doses of ensitrelvir (ETV), nirmatrelvir (NTV) or vehicle (0.5% MC solution) every 12 h (twice daily) for 5 days. The first administration was performed 1 day p.i. (a) Mouse survival was monitored daily. n = 5 mice/group. P values were calculated using log-rank test versus vehicle. *P < 0.05 and **P < 0.001. (b) Body-weight values are presented as a percentage of initial body weight through to Day 14 p.i. The graph bars represent the mean ± SD of 5 mice/group. (c) Lung viral titres were determined using TCID50 assays on the days p.i. indicated. Each point represents the mean ± SD of n = 4–5 mice. The dashed line represents the lower limit of quantification (LLOQ) of 1.80 log10 TCID50/mL. P values were calculated using Tukey’s test. *P < 0.05 versus vehicle; **P < 0.01 versus vehicle; ***P < 0.001 versus vehicle; †P < 0.05 versus 1000 mg/kg NTV; ††P < 0.01 versus 1000 mg/kg NTV; †††P < 0.001 versus 1000 mg/kg NTV. This figure appears in colour in the online version of JAC and in black and white in the print version of JAC.

