An official website of the United States government
Here's how you know
Official websites use .gov
A
.gov website belongs to an official
government organization in the United States.
Secure .gov websites use HTTPS
A lock (
) or https:// means you've safely
connected to the .gov website. Share sensitive
information only on official, secure websites.
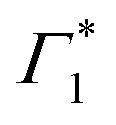
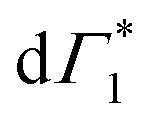
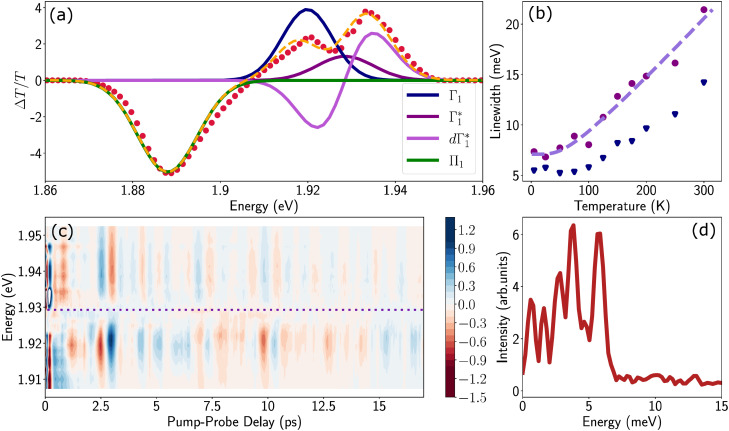
 (positive Gaussian features), the energy shift of the excitonic state (derivative Gaussian shape
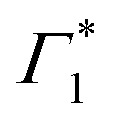
  ) and an associated excited state PA Π1 (negative Gaussian feature). (b) Widths of the fit components for Γ1 (triangles) and
  (circles). A fit with the dispersion relation of optical phonons (dashed red line) gives an estimate of the LO phonon energy of 14.7 meV. (c) Two dimensional map showing the time resolved coherent oscillations upon hot carrier excitation pumping at 3.1 eV, as a function of pump delay time and detection energy. The observed oscillations persist for longer than 20 ps. The nodal point at E = 1.927 eV marks the position of the exciton coupled to the observed coherent phonons. (d) Fourier transform spectrum of the oscillatory dynamics displayed in (c), and integrated over all the probe energies. This corresponds to the resonant impulsive stimulated Raman spectrum of (PEA)2SnI4 at 5 K.