. 2023 Mar 7;4(7):1720–1730. doi: 10.1039/d2ma00136e

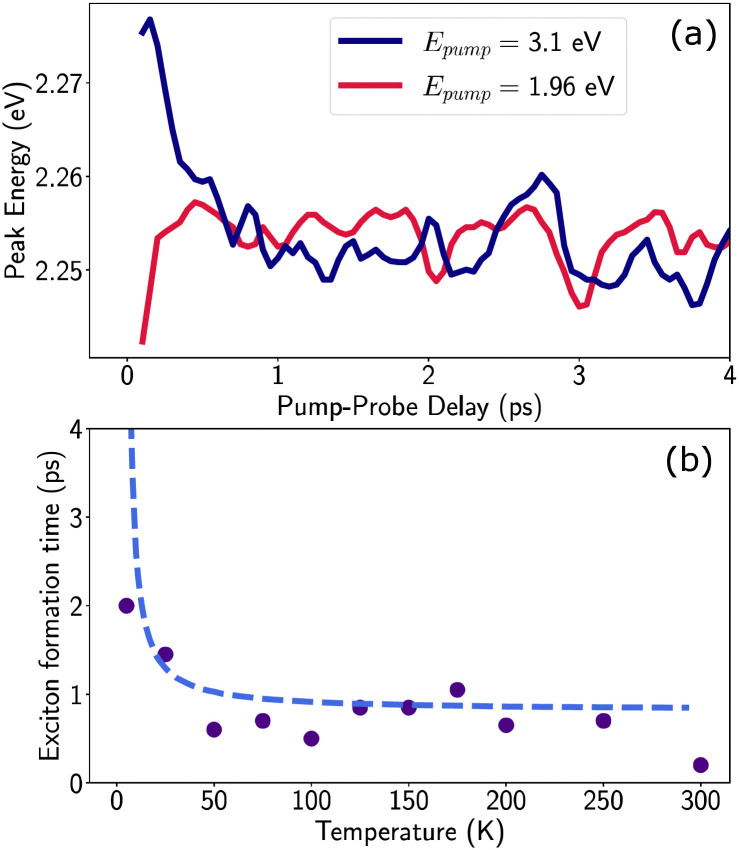
Fig. 5. (a) Peak position of the XHE feature at T = 77 K as a function of pump–probe delay, while for excitation resonant to the excitonic transition (red) no spectral shift occurs, for excitation in the continuum (blue) a red shift occurs in the first picosecond after excitation (b) exciton relaxation time as a function of temperature: as a figure of merit, we consider the time it takes for the XHE peak to match its equilibrium values at long delays when excited in the continuum, up to a 95% tolerance. The resulting exciton formation time is consistent with thermalization driven by 4 meV phonons, as described by the Boltzmann distribution (dashed line).

Fig. 5