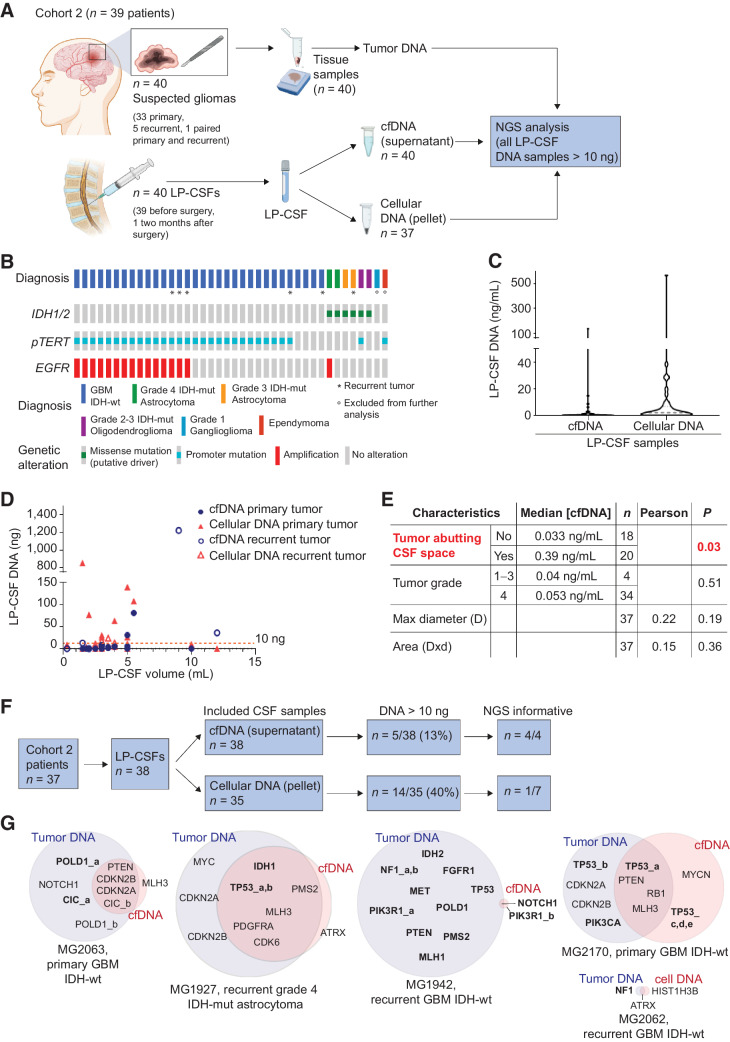
Figure 3.
Cohort 2: LP-CSF NGS analysis. A, Experimental design. Cohort 2 patients yielded fresh or archive tumor tissues (n = 40) and CSF sampled by LP (LP-CSF, n = 40). From LP-CSF, DNA was recovered from either the supernatant (cfDNA) or the pellet (cellular DNA). Wherever possible, tumor tissue DNA and LP-CSF DNA were compared by NGS analysis. B, Oncoprint of Cohort 2 patients based on detection of IDH1/2 mutation by IHC, pTERT sequencing, and EGFR amplification analysis by FISH. C, Analysis of DNA concentration in LP-CSF samples (cfDNA from supernatants or cellular DNA from pellets) in Cohort 2. Gray line, Median DNA concentration (cfDNA = 0.05 ng/mL; cellular DNA = 2.14 ng/mL). D, Analysis of DNA amount (cfDNA from supernatants and cellular DNA from pellets) versus LP-CSF volume in samples from Cohort 2 (n = 38). Primary or recurrent tumors are indicated. Red line indicates the threshold of minimal DNA content (10 ng) required for NGS analysis (Spearman correlation between cfDNA amount and LP-CSF volume, r = 0.38, P = 0.021; between cellular DNA and LP-CSF volume, r = 0.10, P = 0.56). E, Correlation between tumor features (proximity to CSF space, tumor grade, and size) on the one hand, and LP-CSF cfDNA concentration on the other. Median DNA concentrations were compared between groups defined by proximity to CSF space or tumor grades (non parametric Wilcoxon–Mann–Whitney test). Maximal tumor diameter and areas (as reported in Supplementary Table S9) were correlated with DNA concentration in LP-CSF samples (Pearson correlation). n, Number of tumors. Red, statistically significant correlation. F, Flow-chart, shortlisting of LP-CSF samples from collection to NGS eligibility and overall results. G, Venn diagrams summarizing NGS results, showing the degree of correspondence between paired LP-CSF (cfDNA or cellular DNA) and tumor tissue DNA. Pairing between tumor and LP-CSF was verified by SNP ID (Supplementary Data S3). Bold, single-nucleotide variations. Regular, copy-number variations. (A, Created with BioRender.com.)

