Figure 2.
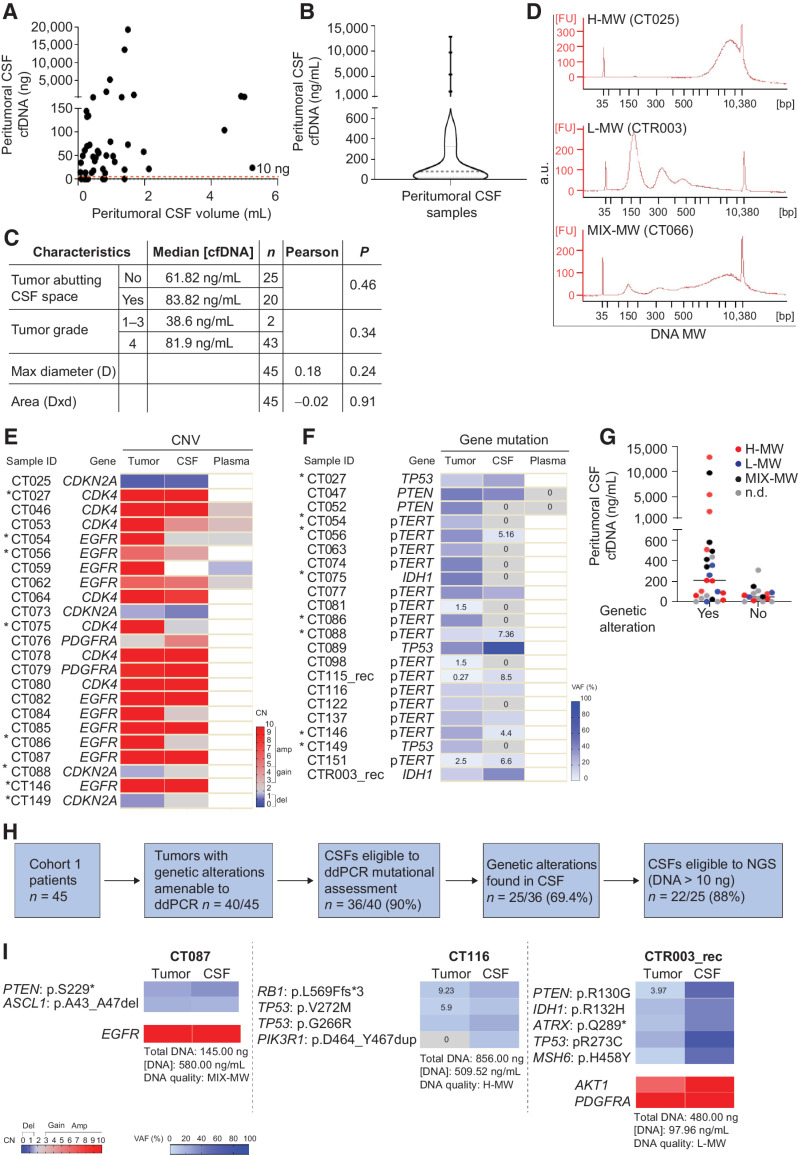
Cohort 1: Comparative analysis of peritumoral CSF and tumor tissues. A, Analysis of DNA amount versus CSF volume in peritumoral CSF samples from Cohort 1 (n = 45). Red line indicates the threshold of minimal DNA content (10 ng) for NGS analysis (Spearman correlation between total CSF DNA amount and volume, r = 0.36, P = 0.014). B, Analysis of cfDNA concentration in peritumoral CSF samples from Cohort 1 (n = 45). Gray line, median DNA concentration = 77.2 ng/mL. C, Correlation between peritumoral CSF cfDNA concentration and tumor features such as proximity to a CSF space (ventricle or cistern), tumor grade, and size. Median cfDNA concentrations were compared between groups defined by proximity to CSF space or tumor grades (non parametric Wilcoxon–Mann–Whitney test). Maximal tumor diameter and areas (as reported in Supplementary Table S1) were correlated with cfDNA concentration in all CSF samples (Pearson correlation). n, number of tumors. D, cfDNA analysis showing the presence of either low (L) or high (H) or mixed (MIX) molecular weight (MW) DNA in representative CSF samples (Bioanalyzer output). E and F, Heatmaps showing peritumoral CSF samples eligible to ddPCR (n = 36) analyzed for selected genetic alterations found in the corresponding tumors. E, copy-number variations (CNV). Red, amplifications (CN > 5) and gains (3 < CN < 5); blue, deletions (CN < 1.5). Color legend for CNV is shown. F, Gene mutations. Color legend for VAF (variant allele frequency) is shown. VAF < 10% are reported. *, Samples tested for both CNV and mutations. G, Dot plot indicating cfDNA concentration and MW features in the groups of peritumoral CSF samples where tumor genetic alterations were detected (yes) or not (no) by ddPCR. No statistically significant association was found between DNA MW type and the possibility to detect mutations in CSF (χ2 test for a Ptrend = 0.39, df = 1). H, Flow-chart: Shortlisting of peritumoral CSF samples from sample collection to eligibility to NGS analysis. I, Comparative NGS analysis showing correspondence between matched peritumoral CSF cfDNAs and tumor tissue DNAs. CSF cfDNA total amount, concentration and quality (MW), and VAF < 10% are reported. Color legends for heatmaps (CN and VAF) are shown.

