. 2023 Jan 17;29(7):1252–1266. doi: 10.1158/1078-0432.CCR-22-2903

Figure 5.

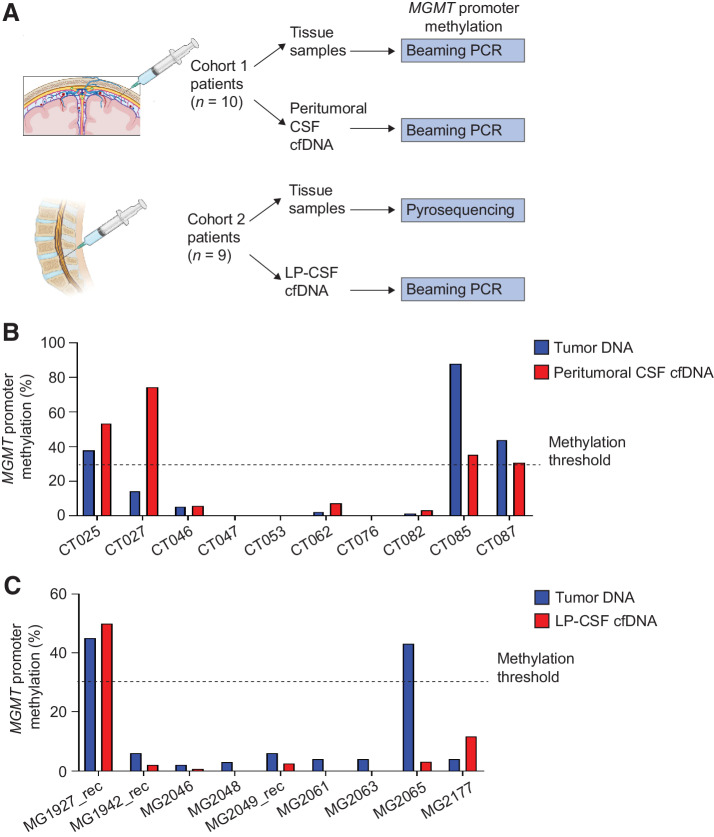
Figure 5. Cohort 1 and 2, MGMT promoter methylation in peritumoral and LP-CSF cfDNA A, Experimental design. A panel of matched tumor tissues and CSFs (Cohort 1, n = 10; Cohort 2: n = 9) underwent evaluation of MGMT promoter methylation either by beaming PCR or pyrosequencing. B, Cohort 1, the percentage of MGMT promoter methylation measured by beaming PCR in a panel of matched tumor DNAs and peritumoral CSF cfDNAs. C, Cohort 2, the percentage of MGMT promoter methylation measured in a panel of matched tumor DNAs (pyrosequencing) and LP-CSF cfDNAs (beaming PCR). Dotted line, threshold to define MGMT promoter methylation (30%).

Cohort 1 and 2: MGMT promoter methylation in peritumoral and LP-CSF cfDNA. A, Experimental design. A panel of matched tumor tissues and CSFs (Cohort 1, n = 10; Cohort 2: n = 9) underwent evaluation of MGMT promoter methylation either by beaming PCR or pyrosequencing. B, Cohort 1, the percentage of MGMT promoter methylation measured by beaming PCR in a panel of matched tumor DNAs and peritumoral CSF cfDNAs. C, Cohort 2, the percentage of MGMT promoter methylation measured in a panel of matched tumor DNAs (pyrosequencing) and LP-CSF cfDNAs (beaming PCR). Dotted line, threshold to define MGMT promoter methylation (30%). (A, Created with BioRender.com.)