Figure 5.
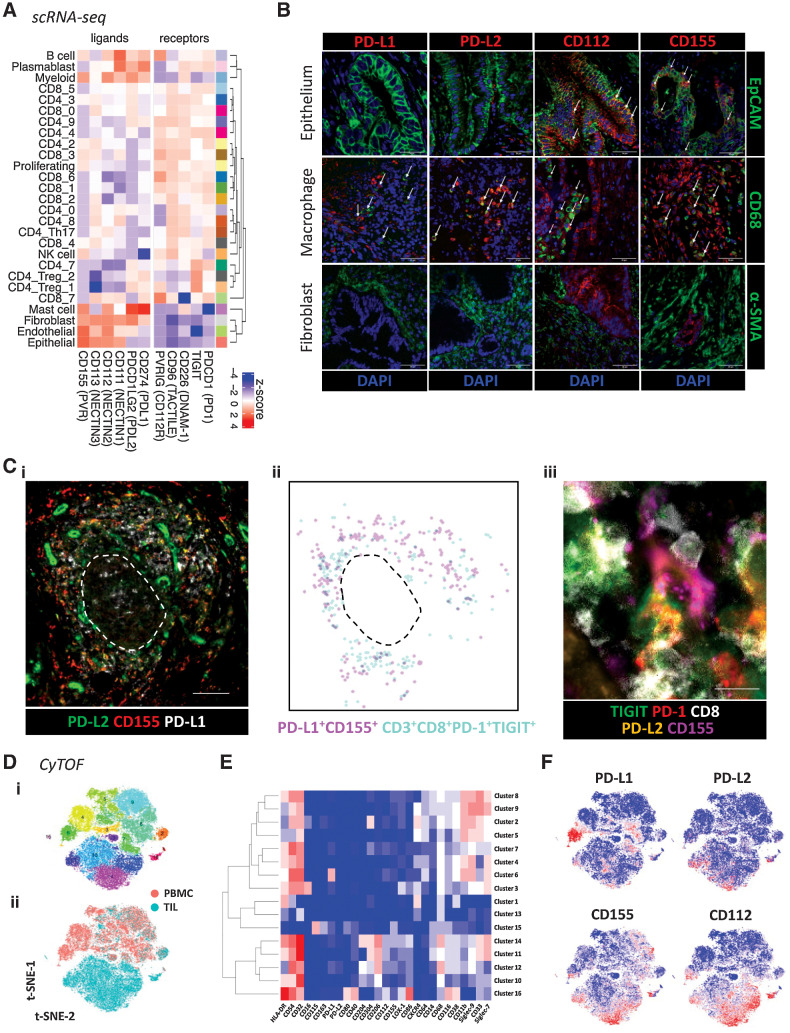
Expression of PD-1 and TIGIT ligands in the PDAC TME. A, Average expression profiles of TIGIT and PD-1 family receptors/ligands on all annotated cell subsets from scRNA-seq data first presented in Fig. 1. B, Representative confocal images of immunofluorescent staining for PD-1 and TIGIT ligands on tumor epithelium (EpCAM+), macrophages (CD68+), and stroma/fibroblasts (α-SMA+) using PDAC FFPE tissue (n = 10 patients). White arrows indicate examples of dual staining. Scale bars: 50 μm. C, Multiplex IHC staining of PD-1 and TIGIT ligands within ectopic lymphoid structures (scale bar: 100 μm; i). Digital representation of cell segmentation and localization of PD-L1+CD155+ cells and PD-1+TIGIT+ CD8+ T cells (ii). Direct engagement of a PD-1+TIGIT+ CD8+ T cell with a PD-L2+CD155+ cell within the T-cell area (scale bar: 10 μm; iii). Dashed line represents the border between the T- and B-cell areas. D, A 35-parameter CyTOF panel was used to determine the expression of PD-1 and/or TIGIT ligands on different myeloid-cell subsets in matched PBMC and TIL samples from patients with PDAC (n = 10). t-SNE plot shows PhenoGraph clusters of myeloid-enriched cell populations from combined PBMC and TIL (i), and cells stratified by sample type (ii). E, Heat map shows median expression level of key markers in each PhenoGraph cluster. F, t-SNE plots show the expression level of PD-1 and TIGIT ligands.

