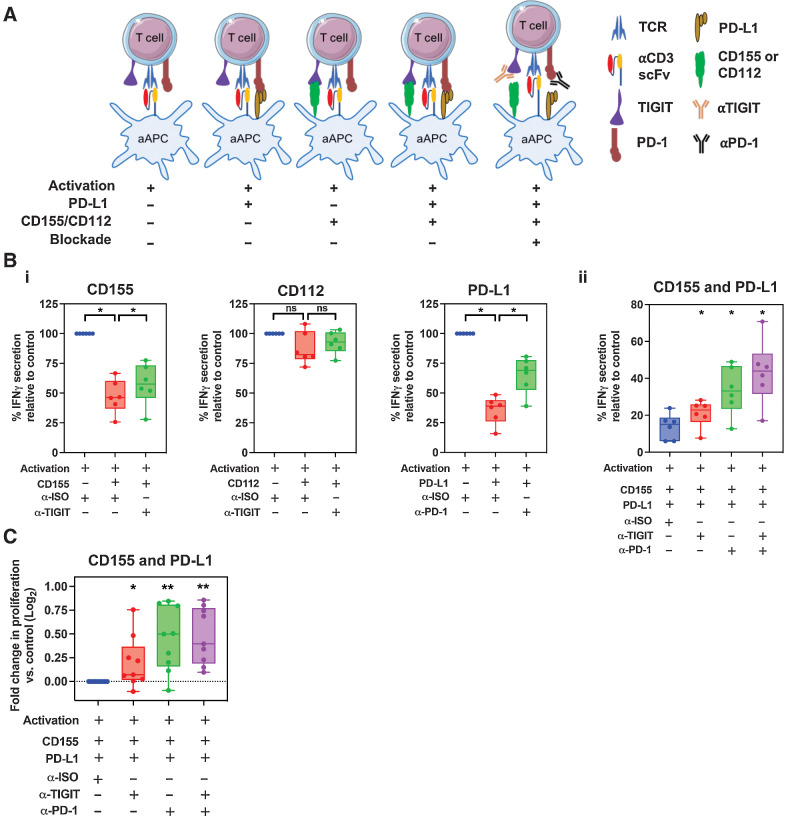
Figure 6.
The effect of T-cell proliferation and cytokine secretion following anti–PD-1 and anti-TIGIT blockade. A, Schematic representation of the CHO-aAPC:T-cell coculture assay. T cells from patients with PDAC were cocultured with aAPCs expressing PD-1 and/or TIGIT ligands for 4 days in the presence of anti-TIGIT and/or anti–PD-1, or with a mAb isotype control. B, Cell culture supernatants from 6 patients in triplicate wells were harvested after 4 days of coculture and IFNγ was quantified by ELISA. Box and whisker graphs compare the levels of IFNγ secreted under 3 conditions—without ligand expression, with ligand expression, and for both ligand expression and mAb blockade with either CD155, CD112, or PD-L1 (i) or dual CD155 and PD-L1 (ii) expression. C, Proliferation of T cells (n = 9 patients) following coculture was determined by CTV dilution and analyzed by flow cytometry on day 4. Box and whisker graphs compare fold change in T-cell proliferation following single or dual CD155/PD-L1 mAb blockade compared with without (isotype mAb) blockade with CHO-aAPCs expressing both CD155 and PD-L1. Horizontal lines represent median, boxes represent quartiles and whiskers represent minimum and maximum values. Data analyzed using Wilcoxon matched-pairs signed rank test. *, P < 0.05; **, P < 0.01.

