. 2023 Jan 30;13(4):1002–1025. doi: 10.1158/2159-8290.CD-22-0805

Figure 2.

Figure 2. Phosphorylation of human TPI1 is LKB1-dependent and regulates triose phosphate levels. A, Volcano plot of quantitative phospho-proteomic data of genetic sensitivity in H2009 clones (2 KP clones and 2 KPL clones), two biological replicates each, N = 4 per genotype. Cells were grown in 0.5 mmol/L glucose for 6 hours. Phosphopeptides that pass statistical criteria (P < 0.05) are highlighted in black, red and blue, peptides that do not satisfy this are colored gray. Phosphopeptides colored red satisfy a fold change > 1.5; colored blue, fold change <−1.5. TPI1 P-Ser21 peptide labeled in purple text. B, Bar graph of summed ion intensities for TPI1 protein expression in H2009 isogenic lines (KP: sgNT1.1 and sgNT1.2; KPL: sgLKB1-3.1 and sgLKB1-3.7). Cell lines were treated with 0.5 mmol/L glucose for 6 hours prior to collection. Data, representative of 4 independent biological experiments and reported as the mean (± SEM). Statistical significance was determined by a two-tailed paired t test. C, Western blot analysis of H358 (KRAS;TP53) isogenic cell (KP: sgNT1.4 and sgNT1.6; KPL: sgLKB1-2.1 and sgLKB1-3.2) and KPL lines to validate phospho-specific antibody. D, Volcano plot for comparison of quantitative phospho-proteomic data of genetic sensitivity in mLUAD cell lines, 634T (KP) and Lkb1-t2 (KPL) in biological triplicate for each condition. Analysis was conducted on cells treated with 0.5 mmol/L glucose for 6 hours in culture. Statistical criteria and color scheme same as for other Volcano plots presented. E, Bar graph of summed ion intensities for TPI1 protein expression in mLUAD lines from companion unenriched total proteomic analysis. Data, representative of 3 independent biological experiments and reported as the mean (± SEM). Statistical significance was determined by a two-tailed paired t test. F, Volcano plot of quantitative phospho-proteomic data of genetic sensitivity in H2009 isogenic clones including clones with transgenic expression of guide RNA-resistant WT or kinase-inactive (KI) LKB1 in LKB1-specific knockouts (sgLKB1-3.1 and sgLKB1-3.7) from Supplementary Fig. S1E; 4 biological replicates each. LKB1 loss-of-function (LOF) group consisted of merging LKB1 knockout lines (KPL: sgLKB1-3.1 and sgLKB1-3.7) with lines expressing guide RNA-resistant LKB1 KI (KPL + LKB1 KI: sgLKB1-3.1 + LKB1 KI and sgLKB1–3.7 + LKB1 KI); and compared with H2009 lines containing nontargeting guide RNA (KP: sgNT1.1 and sgNT1.2) merged with LKB1 knockout lines expressing guide RNA-resistant LKB1 WT (KPL + LKB1 WT: sgLKB1–3.1 + LKB1 WT and sgLKB1-3.7 + LKB1 WT) at the phosphopeptide level. Cells were grown in 0.5 mmol/L glucose for 6 hours. Statistical criteria and color scheme same as for A. TPI1 P-Ser21 peptide labeled in purple text. G, Summed ion intensity of the H2009 (KRAS;TP53) isogenic clones (KP: sgNT1.1 and sgNT1.2; KPL: sgLKB1-3.1 and sgLKB1-3.7) and lines with additional transgenic expression of guide RNA-resistant LKB1 WT; sgLKB1-3.1 + LKB1 WT and sgLKB1-3.7 + LKB1 WT) or LKB1 kinase–inactive (KI; sgLKB1-3.1 + LKB1 KI and sgLKB1-3.7 LKB1 KI) for the phosphopeptide containing Serine 21 of TPI1 from the experiments from which the volcano plot in Supplementary Fig. S2E was derived. Bar graph depicts each genotype individually and shows the restoration of TPI1 phosphorylation in KPL lines expressing transgenic WT LKB1 but not KI LKB1. Ion intensities were normalized to identify TPI1 protein expression from paired unenriched total proteomic analysis across conditions to control for protein expression; the relevant phosphopeptide was observed 3 times in each biological replicate.

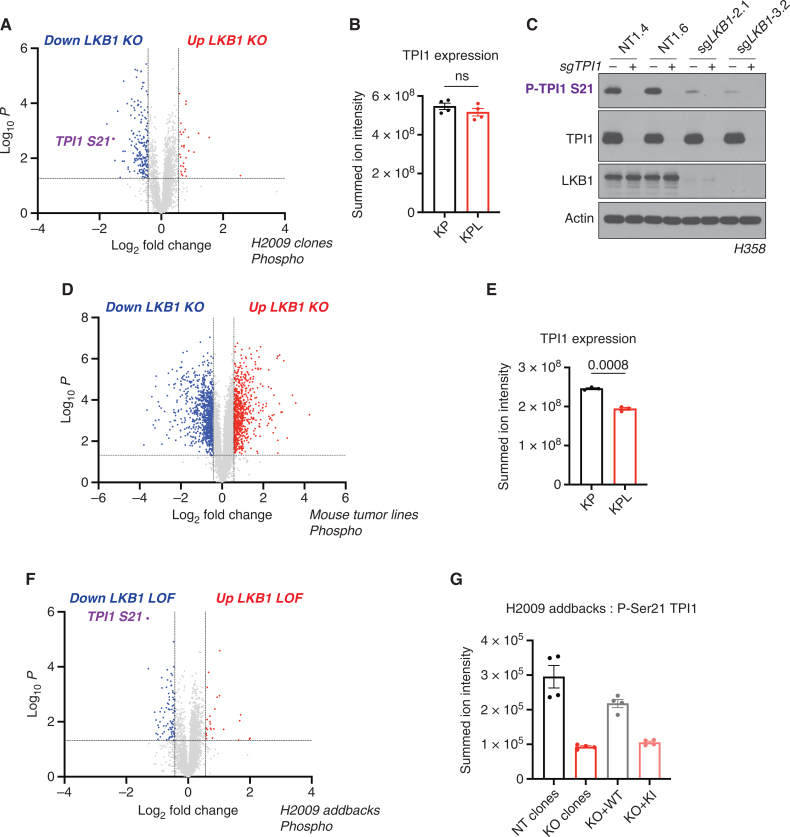
Phosphorylation of human TPI1 is LKB1-dependent and regulates triose phosphate levels. A, Volcano plot of quantitative phosphoproteomic data of genetic sensitivity in H2009 clones (2 KP clones and 2 KPL clones); 2 biological replicates each, n = 4 per genotype. Cells were grown in 0.5 mmol/L glucose for 6 hours. Phosphopeptides that pass statistical criteria (P < 0.05) are highlighted in red and blue; peptides that do not satisfy this are colored gray. Phosphopeptides colored red satisfy a fold change > 1.5 and those colored blue satisfy a fold change < −1.5. The TPI1 P-Ser21 peptide labeled in purple text. KO, knockout. B, Bar graph of summed ion intensities for TPI1 protein expression in H2009 isogenic lines (KP: sgNT1.1 and sgNT1.2; KPL: sgLKB1-3.1 and sgLKB1-3.7). Cell lines were treated with 0.5 mmol/L glucose for 6 hours prior to collection. Data are representative of 4 independent biological experiments and reported as the mean (± SEM). Statistical significance was determined by a two-tailed paired t test. ns, not significant. C, Western blot analysis of H358 (KRAS;TP53) isogenic cell (KP: sgNT1.4 and sgNT1.6; KPL: sgLKB1-2.1 and sgLKB1-3.2) and KPL lines to validate phosphospecific antibody. D, Volcano plot for comparison of quantitative phosphoproteomic data of genetic sensitivity in mLUAD cell lines, 634T (KP) and Lkb1-t2 (KPL), in biological triplicate for each condition. Analysis was conducted on cells treated with 0.5 mmol/L glucose for 6 hours in culture. Statistical criteria and color scheme are the same as for other volcano plots presented. E, Bar graph of summed ion intensities for TPI1 protein expression in mLUAD lines from companion unenriched total proteomic analysis. Data are representative of 3 independent biological experiments and reported as the mean (±SEM). Statistical significance was determined by a two-tailed paired t test. F, Volcano plot of quantitative phosphoproteomic data of genetic sensitivity in H2009 isogenic clones including clones with transgenic expression of guide RNA resistant WT or KI LKB1 in LKB1-specific KO (sgLKB1-3.1 and sgLKB1-3.7) from Supplementary Fig. S1E; 4 biological replicates each. The LKB1 loss-of-function (LOF) group consisted of merging LKB1 KO lines (KPL: sgLKB1-3.1 and sgLKB1-3.7) with lines expressing guide RNA resistant LKB1 KI (KPL + LKB1 KI: sgLKB1-3.1 + LKB1 KI and sgLKB1-3.7 + LKB1 KI), and was compared with H2009 lines containing nontargeting guide RNAs (KP: sgNT1.1 and sgNT1.2) merged with LKB1 KO lines expressing guide RNA resistant LKB1 WT (KPL + LKB1 WT: sgLKB1-3.1 + LKB1 WT and sgLKB1-3.7 + LKB1 WT) at the phosphopeptide level. Cells were grown in 0.5 mmol/L glucose for 6 hours. Statistical criteria and color scheme same as for A. The TPI1 P-Ser21 peptide is labeled in purple text. G, Summed ion intensity of the H2009 (KRAS;TP53) isogenic clones (KP: sgNT1.1 and sgNT1.2; KPL: sgLKB1-3.1 and sgLKB1-3.7) and lines with additional transgenic expression of guide RNA resistant LKB1 WT (sgLKB1-3.1 + LKB1 WT and sgLKB1-3.7 + LKB1 WT) or LKB1 KI (sgLKB1-3.1 + LKB1 KI and sgLKB1-3.7 LKB1 KI) for the phosphopeptide containing Ser21 of TPI1 from the experiments from which the volcano plot in Supplementary Fig. S2E was derived. Bar graph depicts each genotype individually and shows the restoration of TPI1 phosphorylation in KPL lines expressing transgenic WT LKB1 but not KI LKB1. Ion intensities were normalized to identify TPI1 protein expression from paired unenriched total proteomic analysis across conditions to control for protein expression; the relevant phosphopeptide was observed 3 times in each biological replicate.