. 2023 Jan 30;13(4):1002–1025. doi: 10.1158/2159-8290.CD-22-0805

Figure 3.

Figure 3. TPI1 phosphorylation regulates triose phosphate levels and metabolic flux. A, Schematic showing metabolites (shaded in the orange box) chemically labeled to create stable adducts. B, Bar graph depicting in situ chemical-trapping metabolomics of hydroxylamine-labeled GAP and DHAP in H2009 clones (KP: sgNT1.1 and sgNT1.2; KPL: sgLKB1-3.1 and sgLKB1-3.7) treated in culture for 6 hours with 0.5 mmol/L, respectively. Data, representative of three independent biological experiments each containing three technical replicates and reported as the mean (± SEM). Cell number normalized across models 12 hours prior to assay and samples normalized to an exogenous standard, d 3-serine. Statistical significance was determined by a two-tailed paired t test. C, Normalized ion intensity of glycerol-3-phosphate from steady-state analysis of H2009 clones treated for 30 minutes with 0.5 mmol/L glucose. Analysis conducted in H2009 isogenic clones (KP: sgNT1.1 and sgNT1.2; KPL: sgLKB1-3.1 and sgLKB1-3.7) in biological triplicate and reported as the mean (± SEM). Statistical significance was determined by a two-tailed paired t test. D, Schematic showing isotopic glucose tracing using positionally labeled 1,2-13C2 glucose with circles representing carbons in each metabolite. Red circles indicate isotopic carbons and direct path to lipid synthesis through DHAP. Pink circles indicate readout of TPI1 conversion of DHAP to GAP and downstream glycolytic intermediates as well as alternate flux through the oxidative pentose phosphate pathway. Green text indicates metabolites monitored and presented in histograms. E, Isotopic tracing results for M+2 isotopologues at 5-minute time point. Analysis conducted in H358 isogenic lines (KP: sgNT1.4 and sgNT1.6; KPL: sgLKB1-2.1 and sgLKB1-3.2) in biological triplicate (N = 6 per genotype) and reported as the mean (± SEM). Statistical significance was determined by a two-tailed paired t test. F, Isotopic tracing results for M+2 isotopologue for glycerol-3-phosphate at 30 seconds, 1, 2, and 5 minutes. Analysis conducted in H358 isogenic lines (KP: sgNT1.4 and sgNT1.6; KPL: sgLKB1-2.1 and sgLKB1-3.2) in biological triplicate (N = 6 per genotype) and reported as the mean (± SEM). Statistical significance was determined by a two-tailed paired t test. G, Mitochondrial Stress test results; oxygen consumption rate (OCR) and ECAR plotted over the course of the assay. Analysis conducted in H358 isogenic lines (KP: sgNT1.4 and sgNT1.6; KPL: sgLKB1-2.1 and sgLKB1-3.2) in biological triplicate (N = 6 per genotype) and reported as the mean (± SEM) and treated as indicated with normal (11.1 mmol/L) or low (0.5 mmol/L) glucose for 6 hours prior.

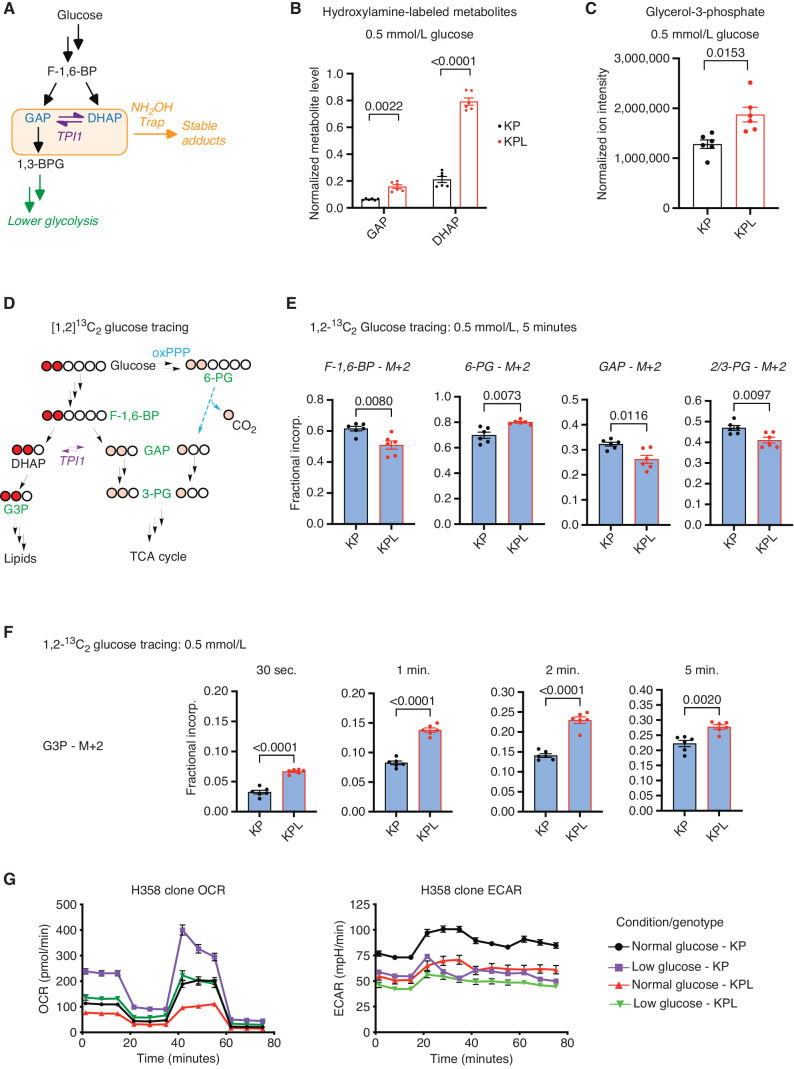
TPI1 phosphorylation regulates triose phosphate levels and metabolic flux. A, Schematic showing metabolites (shaded in the orange box) chemically labeled to create stable adducts. 1,3-BPG, 1,3-bisphosphoglycerate. B, Bar graph depicting in situ chemical-trapping metabolomics of hydroxylamine-labeled GAP and DHAP in H2009 clones (KP: sgNT1.1 and sgNT1.2; KPL: sgLKB1-3.1 and sgLKB1-3.7) treated in culture for 6 hours with 0.5 mmol/L. Data are representative of 3 independent biological experiments each containing 3 technical replicates and reported as the mean (±SEM). Cell number was normalized across models 12 hours prior to assay, and samples were normalized to an exogenous standard, d3-serine. Statistical significance was determined by a two-tailed paired t test. C, Normalized ion intensity of G3P from steady-state analysis of H2009 clones treated for 30 minutes with 0.5 mmol/L glucose. Analysis conducted in H2009 isogenic clones (KP: sgNT1.1 and sgNT1.2; KPL: sgLKB1-3.1 and sgLKB1-3.7) in biological triplicate and reported as the mean (± SEM). Statistical significance was determined by a two-tailed paired t test. D, Schematic showing isotopic glucose tracing using positionally labeled 1,2-13C2 glucose, with circles representing carbons in each metabolite. Red circles indicate isotopic carbons and direct path to lipid synthesis through DHAP. Pink circles indicate readout of TPI1 conversion of DHAP to GAP and downstream glycolytic intermediates as well as alternate flux through the oxPPP. Green text indicates metabolites monitored and presented in histograms. E, Isotopic tracing results for M+2 isotopologues at 5-minute time point. Analysis conducted in H358 isogenic lines (KP: sgNT1.4 and sgNT1.6; KPL: sgLKB1-2.1 and sgLKB1-3.2) in biological triplicate (n = 6 per genotype) and reported as the mean (± SEM). Statistical significance was determined by a two-tailed paired t test. F, Isotopic tracing results for M+2 isotopologue for G3P at 30 seconds and 1, 2, and 5 minutes. Analysis conducted in H358 isogenic lines (KP: sgNT1.4 and sgNT1.6; KPL: sgLKB1-2.1 and sgLKB1-3.2) in biological triplicate (n = 6 per genotype) and reported as the mean (± SEM). Statistical significance was determined by a two-tailed paired t test. G, Mitochondrial stress test results; oxygen consumption rate (OCR) and extracellular acidification rate (ECAR) plotted over the course of the assay. Analysis conducted in H358 isogenic lines (KP: sgNT1.4 and sgNT1.6; KPL: sgLKB1-2.1 and sgLKB1-3.2) in biological triplicate (n = 6 per genotype) and reported as the mean (± SEM) and treated as indicated with normal (11.1 mmol/L) or low (0.5 mmol/L) glucose for 6 hours prior.