. 2023 Jan 30;13(4):1002–1025. doi: 10.1158/2159-8290.CD-22-0805

Figure 4.

Figure 4. SIK phosphorylate human TPI1 in KP hLUAD cell lines. A, Cartoon depicting regulation of the AMPK-related (AMPKR) kinase family members by LKB1 and their downstream substrates. B, Bar graph of summed ion intensity for the TPI1-derived Ser-21 phosphopeptide from extracts of A549 cell lines infected with an empty vector or a vector expressing WT LKB1; the indicated guide RNAs were used to inactivate members of the AMPKR subfamilies in LKB1 transgenic expressing cells. Cell lines were cultured in 11.1 mmol/L glucose prior to analysis. Ion intensities were normalized to identified nonphosphorylated peptides across conditions to control for protein expression and reported as the mean (± SEM). C, Volcano plot of quantitative phospho-proteomic data used to compare phosphorylation in H358 clones (2 KP clones and 2 KP SIK TKO clones, with 3 biological replicates of each). Cells were cultured in 0.5 mmol/L glucose for 6 hours before lysis. Phosphopeptides that pass statistical criteria (P < 0.05) are highlighted in black, red, and blue; those that do not satisfy this criterion are colored gray. Proteins highlighted in red satisfy the fold change threshold (>1.5) after triple deletion of SIK1,2,3. Phosphopeptides highlighted in blue satisfy the fold change threshold of <−1.5) for a decrease after SIK1,2,3 triple deletion. D, Bar graph of summed ion intensities for the TPI1-derived, Ser-21 phosphopeptide in extracts of isogenic H358 cell lines containing a nontargeting control (sgNT1.3 and sgNT1.4) or SIK1-specific (sgSIK1.3 and sgSIK1.4) guide RNA and additional control (NT1) SIK1 (sgSIK1) or dual SIK2 and SIK3 (sgSIK2/3) guide RNAs in a polyclonal population. Ion intensities were normalized against identified nonphosphorylated variant across conditions. Cell lines were cultured in 0.5 mmol/L glucose prior to lysis, analyzed in biological triplicate per clone, N = 6 per genotype, and reported as the mean ((± SEM). Statistical significance was determined by a two-tailed paired t test. E, Mitochondrial stress test results; OCR and ECAR plotted over the course of the assay, respectively. Analysis conducted in H358 isogenic lines used for phospho-proteomic analysis in D in biological triplicate (N = 6 per genotype) and reported as the mean ((± SEM) and treated as indicated with normal (11.1 mmol/L) or low (0.5 mmol/L) glucose for 6 hours prior. F, 3D spheroid growth in Matrigel of isogenic clones of the H358 cell line labeled with a tdTomato fluorescent reporter and expressing CAS9 and nontargeting controls (sgNT1.3) or SIK1-specific (sgSIK1-2.3) guide RNA and additional control (NT1) or dual SIK2 and SIK3 (sgSIK2/3) guide RNAs in a polyclonal population. 5,000 cells were seeded into Matrigel and grown for 14 days, and the media were changed every 24 hours. Images were taken on an EVOS fluorescence microscope under 4× magnification and filtered to resolve tdTomato signal intensity and brightfield.

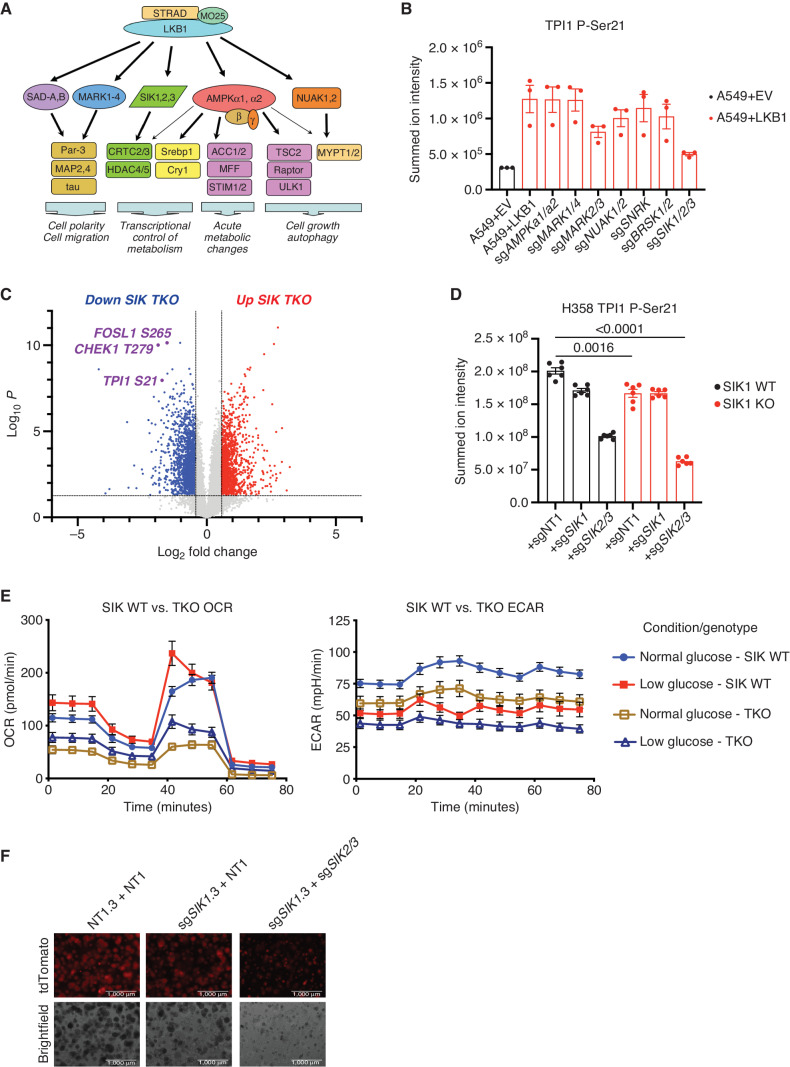
SIKs phosphorylate human TPI1 in KP hLUAD cell lines. A, Cartoon depicting regulation of the AMPKR kinase family members by LKB1 and their downstream substrates. B, Bar graph of summed ion intensity for the TPI1-derived Ser21 phosphopeptide from extracts of A549 cell lines infected with an empty vector (EV) or a vector expressing WT LKB1; the indicated guide RNAs were used to inactivate members of the AMPKR subfamilies in LKB1 transgenic expressing cells. Cell lines were cultured in 11.1 mmol/L glucose prior to analysis. Ion intensities were normalized to identified nonphosphorylated peptides across conditions to control for protein expression and reported as the mean (±SEM). C, Volcano plot of quantitative phosphoproteomic data used to compare phosphorylation in H358 clones (2 KP clones and 2 KP SIK TKO clones, with 3 biological replicates of each). Cells were cultured in 0.5 mmol/L glucose for 6 hours before lysis. Phosphopeptides that pass statistical criteria (P < 0.05) are highlighted in red and blue; those that do not satisfy this criterion are colored gray. Proteins highlighted in red satisfy the fold change threshold of >1.5 after triple deletion of SIK1,2,3. Phosphopeptides highlighted in blue satisfy the fold change threshold of < −1.5 for a decrease after SIK1,2,3 triple deletion. D, Bar graph of summed ion intensities for the TPI1-derived Ser21 phosphopeptide in extracts of isogenic H358 cell lines containing a nontargeting control (sgNT1.3 and sgNT1.4) or SIK1-specific (sgSIK1.3 and sgSIK1.4) guide RNA and additional control (NT1), SIK1 (sgSIK1), or dual SIK2 and SIK3 (sgSIK2/3) guide RNAs in a polyclonal population. Ion intensities were normalized against identified nonphosphorylated variant across conditions. Cell lines were cultured in 0.5 mmol/L glucose prior to lysis, analyzed in biological triplicate per clone (n = 6 per genotype), and reported as the mean (± SEM). Statistical significance was determined by a two-tailed paired t test. KO, knockout. E, Mitochondrial stress test results; oxygen consumption rate (OCR) and ECAR plotted over the course of the assay, respectively. Analysis conducted in H358 isogenic lines used for phosphoproteomic analysis in D in biological triplicate (n = 6 per genotype) and reported as the mean (± SEM) and treated as indicated with normal (11.1 mmol/L) or low (0.5 mmol/L) glucose for 6 hours prior. F, 3D spheroid growth in Matrigel of isogenic clones of the H358 cell line labeled with a tdTomato fluorescent reporter and expressing Cas9 and nontargeting controls (sgNT1.3) or SIK1-specific (sgSIK1-2.3) guide RNA and additional control (NT1) or dual SIK2 and SIK3 (sgSIK2/3) guide RNAs in a polyclonal population. Five thousand cells were seeded into Matrigel and grown for 14 days, and the media were changed every 24 hours. Images were taken on an EVOS fluorescence microscope under 4× magnification and filtered to resolve tdTomato signal intensity and brightfield.