. 2023 Jan 23;29(7):1344–1359. doi: 10.1158/1078-0432.CCR-22-2747

Figure 3.

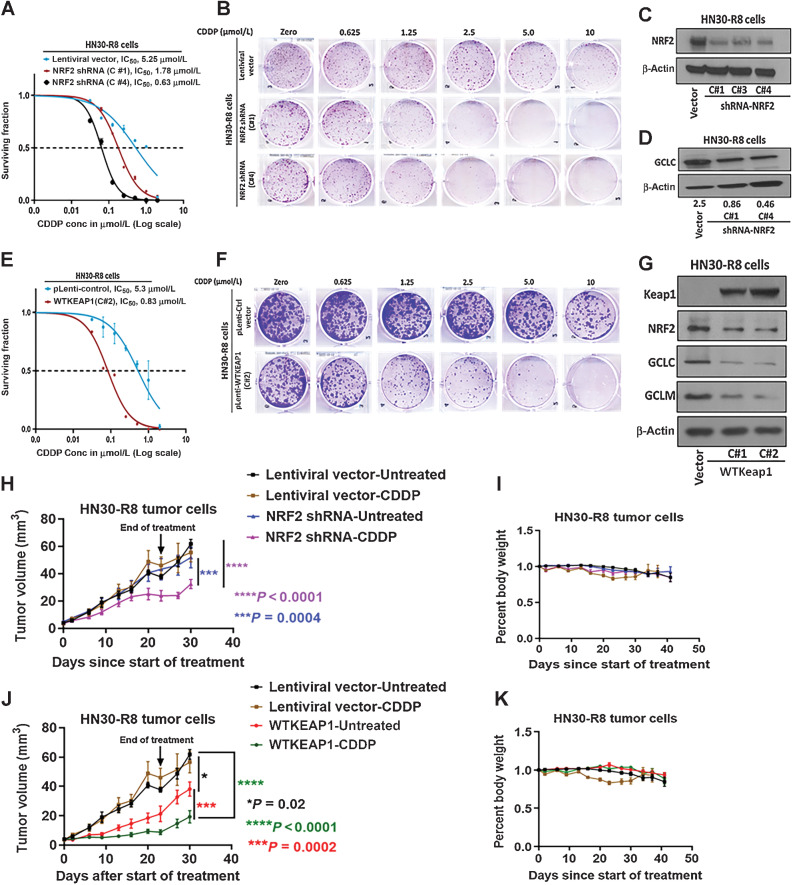
Figure 3. NRF2 targeted suppression or restoration of WT KEAP1 inhibits in vitro and in vivo tumor growth. HN30-R8 cells were transduced with NRF2 shRNA and WT KEAP1 constructs and the established stable cell lines were subjected to clonogenic survival assays following CDDP treatment and compared with control transfected cells as described in Methods. A and B, survival curves and representative clonogenic survival images showing that CDDP resistance is reversed in HN30R8 following NRF2 shRNA KD. C and D, Western blots confirming successful KD of NRF2, associated with decreased GCLC downstream target proteins in clones, C#1, C#3, and C#4 respectively. E and F, survival curves and representative clonogenic survival images showing that CDDP resistance is also reversed in HN30-R8 after restoring WT KEAP1. G, reduction in downstream targets GCLC and GCLM following the restoration of WT KEAP1 in clones, C#1 and C# 2 respectively. H–K, tumor growth curves and percent body weight loss in orthotopic mouse model during the treatment with CDDP respectively. Shown are measurements from oral tongues bearing HN30-R8 cells stably expressing, NRF2 shRNA or WT KEAP1 following treatment with CDDP (4 mg/kg) for 4 weeks as indicated. Tumor cells expressing the same lentiviral vectors were used as control and identical for experiments presented in H and I and J and K. Each treatment group contains 8 to 10 mice. All in vivo data were expressed as ± SEM and P values < 0.05 were considered significant.

NRF2 targeted suppression or restoration of WT KEAP1 inhibits in vitro and in vivo tumor growth. HN30-R8 cells were transduced with NRF2 shRNA and WT KEAP1 constructs and the established stable cell lines were subjected to clonogenic survival assays following CDDP treatment and compared with control transfected cells as described in Methods. A and B, Survival curves and representative clonogenic survival images showing that CDDP resistance is reversed in HN30R8 following NRF2 shRNA KD. C and D, Western blots confirming successful KD of NRF2, associated with decreased GCLC downstream target proteins in clones C#1, C#3, and C#4 respectively. E and F, Survival curves and representative clonogenic survival images showing that CDDP resistance is also reversed in HN30-R8 after restoring WT KEAP1. G, Reduction in downstream targets GCLC and GCLM following the restoration of WT KEAP1 in clones C#1 and C#2, respectively. HK, Tumor growth curves and percent body weight loss in orthotopic mouse model during the treatment with CDDP. Shown are measurements from oral tongues bearing HN30-R8 cells stably expressing NRF2 shRNA or WT KEAP1 following treatment with CDDP (4 mg/kg) for 4 weeks as indicated. Tumor cells expressing the same lentiviral vectors were used as control and identical for experiments presented in H, I, J, and K. Each treatment group contains 8 to 10 mice. All in vivo data were expressed as ± SEM and P values < 0.05 were considered significant.