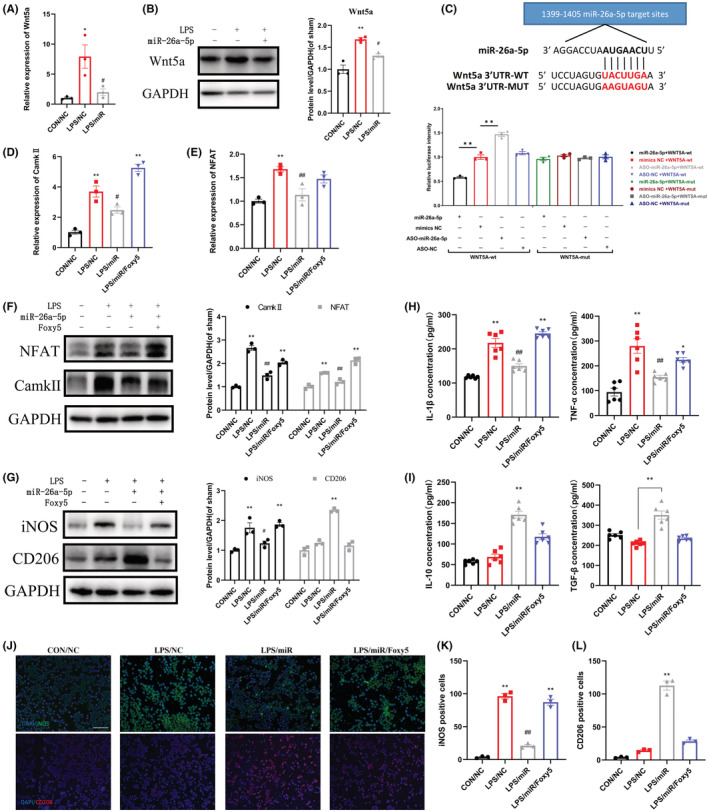
FIGURE 5.

miR‐26a‐5p suppresses LPS‐induced inflammation in BV2 cells in vitro through noncanonical Wnt signaling. (A, B) mRNA(A) and protein(B) levels of Wnt5a in CON/NC, LPS/NC, and LPS/miR groups. The LPS/miR group decreased significantly compared with LPS/NC group. (C) The binding and mutant sequence of miR‐26a‐5p in Wnt5a and Luciferase reporter assays in BV2 cells after co‐transfection of cells with the wild type or mutant 3’‐UTR of Wnt5a and the miR‐26a‐5p, NC mimics or ASO‐miR‐26a‐5p, ASO‐NC. (D–F) mRNA(D, E) and protein(F) levels of CaMKII and NFAT in CON/NC, LPS/NC, LPS/miR, and LPS/miR/Foxy5 groups. (G) Western blot was used to assess the level of iNOS and CD206 of BV2 cells. Data are expressed as fold change compared to the sham group. (H, I) The protein levels of IL‐1β, TNF‐α(H), IL‐10, and TGF‐β(I) in cell culture supernatant were tested by ELISA. (J) Immunofluorescent study revealed iNOS‐positive (green) and CD206‐positive (red) BV2 cells. The blue spots are DAPI nuclear staining (scale bar: 100 μm). (K, L) Quantification showing the number of iNOS‐positive(K) and CD206‐positive(L) BV2 cells. Data are represented as mean ± sem. *p < 0.05, **p < 0.01. #p < 0.05, ##p < 0.01.
