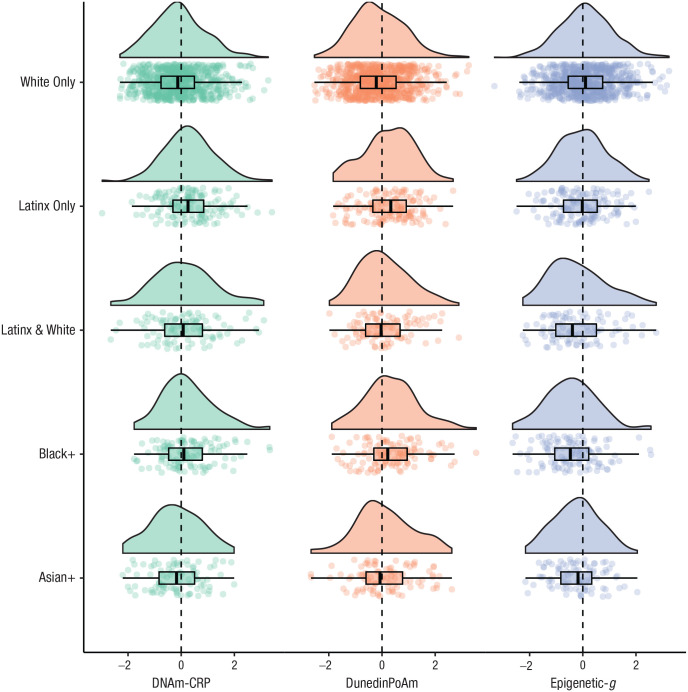
Fig. 2.
Raincloud plot of associations between self-identified racial/ethnic identity and three DNA methylation profiles in children and adolescents. DNA methylation profile values are in standard deviation units. The racial/ethnic identity boxplots display group DNA methylation differences in the mean (black midline), standard errors of the mean (error bars), the first and third quartiles (lower and upper hinges), and the mean across groups (black dashed line). Participants self-identified as White only (62%), Latinx only (12.2%), Latinx and White (8.1%), Black and potentially another race/ethnicity (10%), Asian and potentially another race/ethnicity but not Latinx or Black (7.5%), and Indigenous American, Pacific Islander or other, but not Latinx, Black, or Asian (0.6%, not shown because of small sample size). For standardized regression coefficients with and without covariate controls for body mass index, puberty, and socioeconomic inequality, see Table S2 in the Supplemental Material available online. DNAm-CRP = DNA methylation profiles of C-reactive protein; DunedinPoAm = Dunedin methylation pace of aging; Epigenetic-g = DNA methylation profiles of cognitive performance.

