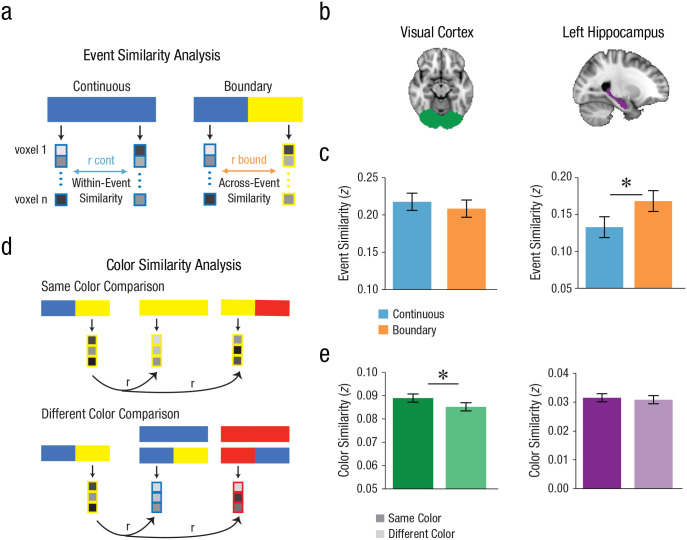
Fig. 2.
Pattern similarity approaches. (a) Event similarity was computed as the Fisher-transformed Pearson correlation between the estimated evoked activity at the beginning of an 8-s trial and the estimated evoked activity at the end of that 8-s trial. Correlations were computed separately for continuous and boundary trials. (b) Regions of interest: visual cortex (left) and left hippocampus (right). (c) Left: The visual cortex did not show differential event similarity by condition. Right: The left hippocampus exhibited greater event similarity across boundary trials than across continuous trials. (d) Color similarity was computed as the Fisher-transformed Pearson correlation between the estimated evoked activity at the end of an 8-s trial and the estimated evoked activity at the beginning of another trial that shares the same color. As a comparison, different-color trials were computed as the correlation between the patterns at the end of one trial and the beginning of all other trials that did not share its color. (e) Left: The visual cortex exhibited greater similarity for trials of the same color than trials of a different color. Right: The left hippocampus did not show differential similarity as a function of trial color. *p < .05 (two-tailed). Error bars denote the within-participants standard error of the mean.

