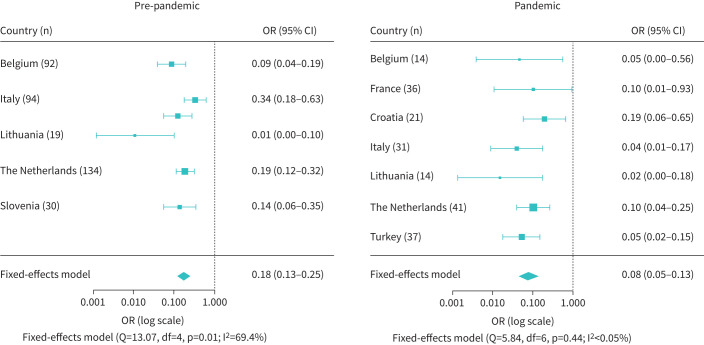
FIGURE 2.
Forest plot of the odds of having experienced two or more exacerbations per year after mepolizumab initiation compared to the year before initiating mepolizumab for the individual countries and the countries combined. The odds were statistically significantly reduced for both the pre-pandemic group (n=369) and the pandemic group (n=194).

