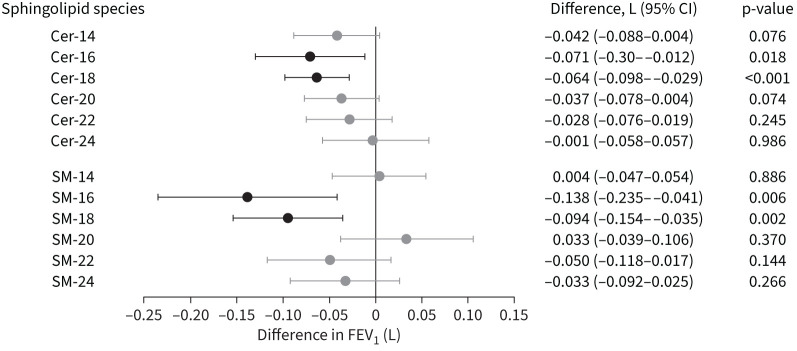
FIGURE 2.
Ceramide (Cer) and sphingomyelin (SM) associations with forced expiratory volume in 1 s (FEV1). A forest plot of 12 sphingolipid concentrations (six ceramides and six sphingomyelins) on the vertical axis are plotted against the corresponding difference in absolute FEV1 value measured in litres. Differences in FEV1 (L) are shown for a two-fold change for each sphingolipid species. Associations with p<0.05 are shown in black.

