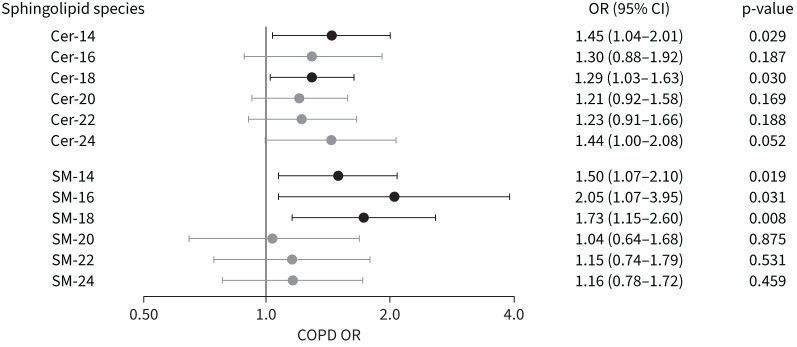
FIGURE 3.
Ceramide (Cer) and sphingomyelin (SM) associations with odds of COPD. A forest plot of 12 sphingolipid concentrations (six ceramides and six sphingomyelins) on the vertical axis are plotted against the corresponding odds ratio for COPD. Odds ratios are shown for a two-fold change for each sphingolipid species. Associations with p<0.05 are shown in black.

