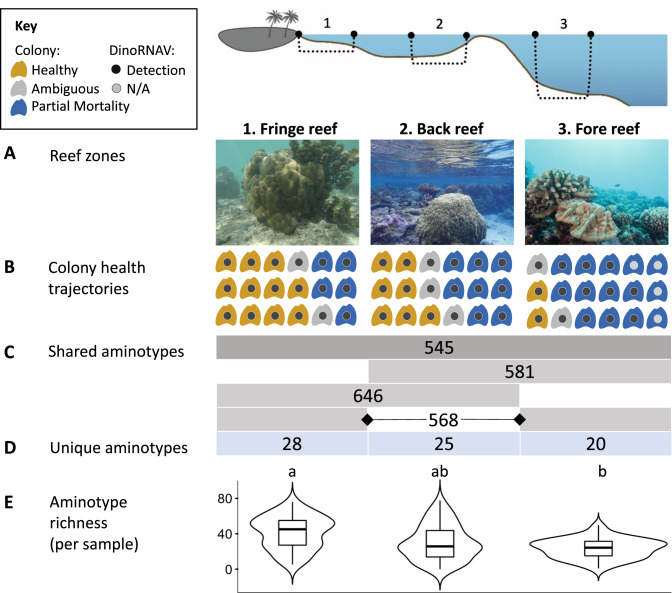
Fig. 1. Sampling overview and dinoRNAV detection summary from Porites lobata colonies on the reefs of Moorea, French Polynesia (South Pacific).
A Schematic cross section of sampled reef zones and representative images of focal Porites lobata coral colonies in each reef environment. Eighteen colonies per reef zone were tagged and sampled four times from August 2018 to October 2020. B Health trajectories of colonies between August 2018 and October 2020 based on image analysis. Orange icons represent colonies that remained visually healthy throughout the sampling duration, whereas blue icons indicate colonies that experienced partial mortality. Gray icons indicate colonies for which health trajectory was ambiguous based on the images available. Dark gray center dots indicate dinoRNAV detection. Light gray “N/A” dots indicates that a colony that was not sequenced due to poor RNA quality. C Number of unique dinoRNAV major capsid protein amino acid sequences (‘aminotypes’) detected in samples from all three reef zones (darker gray) or in two of the three zones (lighter gray). D Number of aminotypes detected exclusively in colonies within a given reef zone. E Boxplot and width distribution of aminotype richness per colony. Letters indicate significant differences in dinoRNAV aminotype richness based on a pairwise Wilcoxon test with Bonferroni correction (fringe vs. back, p = 0.10; fringe vs. fore, p < 0.01; back vs. fore, p = 0.99).

