
Fig. 1.
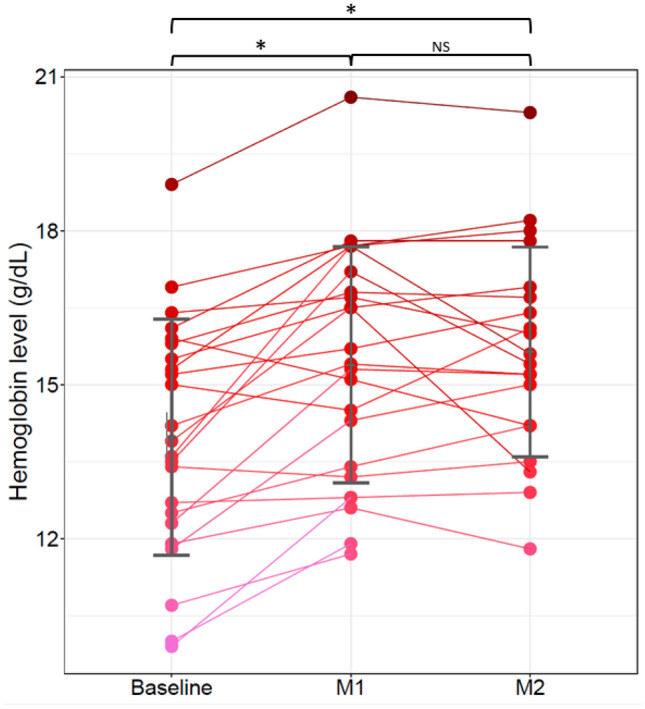
Individual effect of lenvatinib on hemoglobin level per patient over time. Hb levels for each patient at baseline, M1 and M2. Of note, three patients (pink lines and dots) did not have M2 data, one who discontinued lenvatinib after the first month of treatment and missing information for the two others. However, one of those had a blood test at M3 confirming an increased level between M1 and M3 (12.8 g/dL to 14.2 g/dL). Gray bars represent the mean and standard deviation of Hb level at each time point. Between months comparison are represented by square brackets on the top of the figure. (*statistical significance p < 0.05; NS not significant)