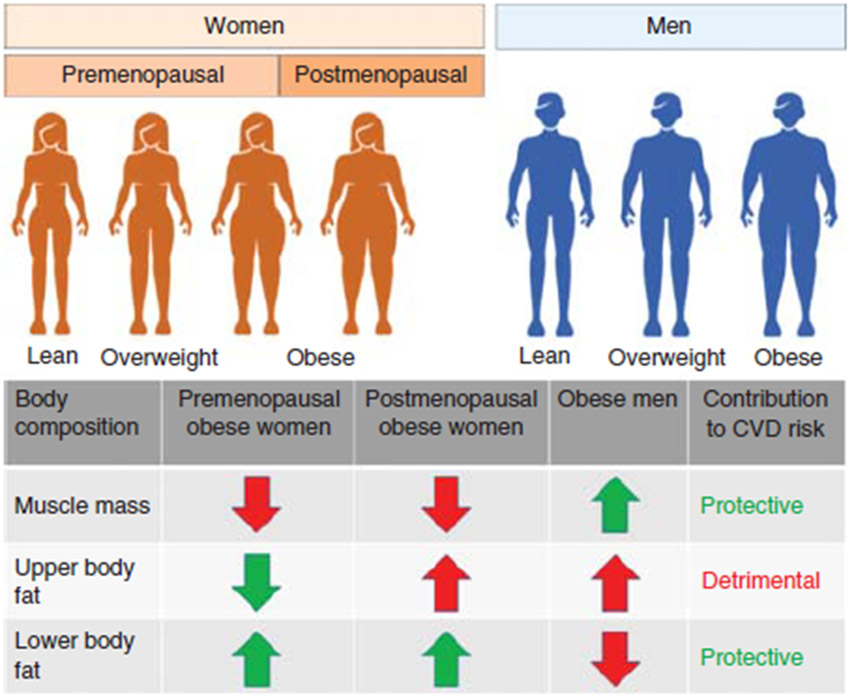
Figure 1.
Schematic highlighting the differential body composition and fat distribution in men and women along with its contribution towards CVD risk. Changes in body fat distribution in postmenopausal women are emphasized. Arrows indicate prevalence of body composition variables in obese women and men. Downward arrows indicate low prevalence and upward arrows indicate high prevalence. Green-colored text and arrows indicate cardioprotective effects and red-colored text and arrows indicate detrimental cardiovascular effects.

