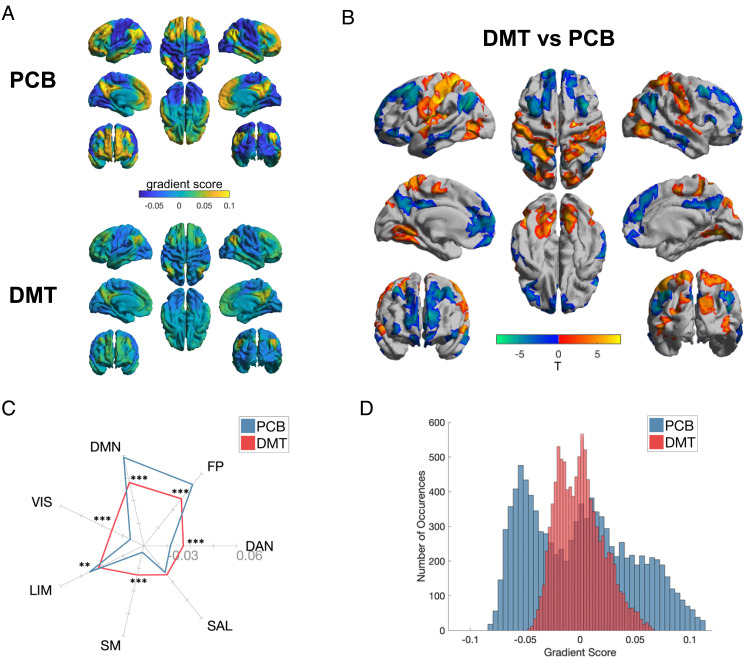
Fig. 3.
Compression of the principal gradient under DMT. (A) Mean principal gradient for the placebo (Top) and DMT (Bottom) conditions, representing the principal axis from unimodal to transmodal cortex. (B) DMT > Placebo between-group vertex-wise (Top) and (C) network-wise (Bottom) contrasts. Network-wise radial plot displays the mean intranetwork principal gradient score for each network for DMT and placebo (*P < 0.05, **P < 0.01, ***P < 0.001; FDR corrected). (D) Histogram showing the distribution of principal gradient values for placebo and DMT conditions for each brain area. (Networks: VIS = visual; SM = somatomotor; DAN = dorsal attentional; SAL = ventral attentional/salience; LIM = limbic; FP = frontoparietal; DMN = default mode).

