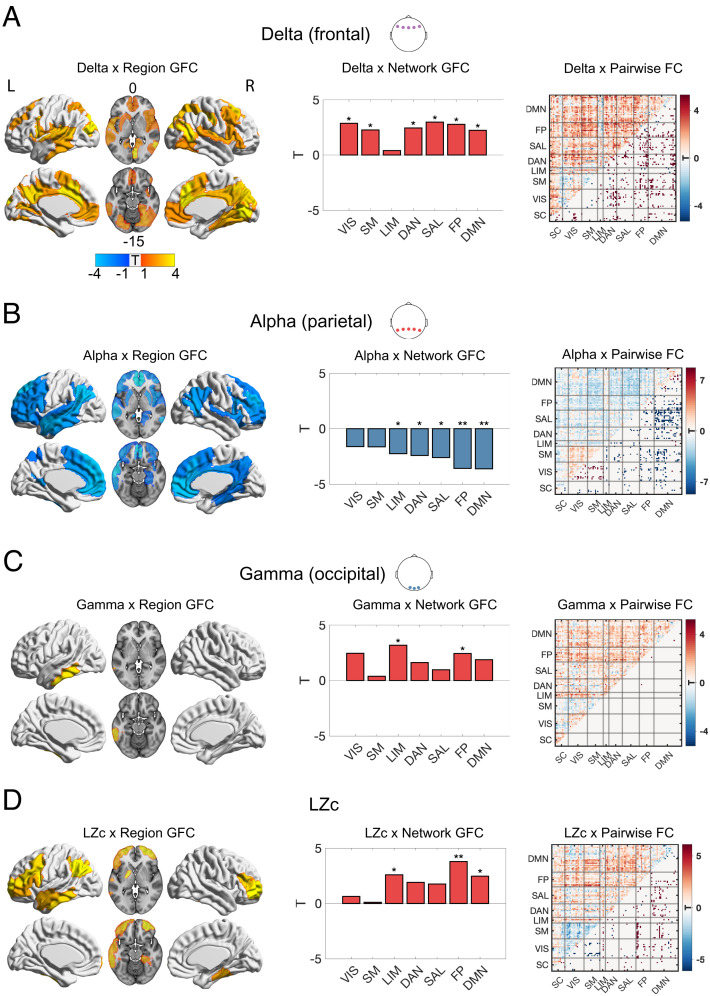
Fig. 5.
EEG changes in relation to fMRI RSFC changes. Displayed in A–D are associations between EEG measures and global functional connectivity (GFC) per region (left brain surfaces; significant regions displayed; P < 0.05, FDR corrected), network GFC (middle bar plots; significant P < 0.05, FDR corrected), and pairwise functional connectivity (FC) (right correlation matrices with significant links displayed in the lower quadrants; P < 0.05, FDR corrected). (A) Frontal delta power was positively associated with widespread GFC and distributed connections. (B) Parietal alpha power was negatively associated with GFC in high-level and attentional networks, as well as the limbic network. (C) Occipital gamma power was positively associated with increases in GFC at frontoparietal and limbic networks. (D) Signal diversity (LZc) was associated with increases in GFC at high-level and limbic networks (*P < 0.05, **P < 0.01, ***P < 0.001; FDR corrected). (Networks: VIS = visual; SM = somatomotor; DAN = dorsal attentional; SAL = ventral attentional/salience; LIM = limbic; FP = frontoparietal; DMN = default mode; SC = subcortical regions)

