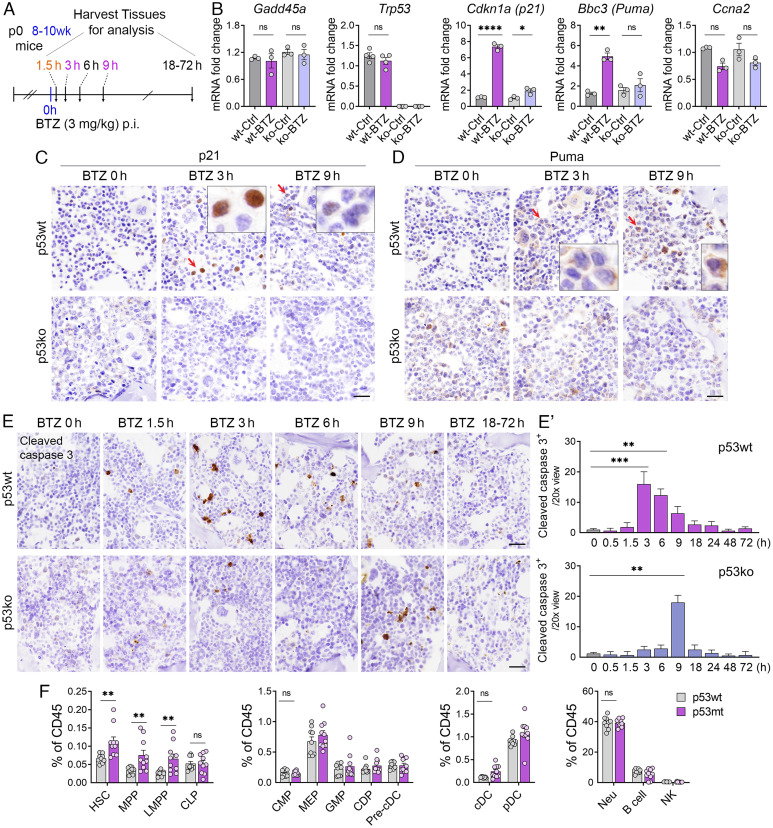
Fig. 3.
p53 target gene expression and apoptosis induction in bone marrow following bortezomib treatment. (A) The schedule of bortezomib (BTZ) experiments for detecting p53 target gene and apoptotic induction (n = 3 to 4). p0, neonatal; wk, week, h, hour; p.i., intraperitoneal injection. (B) qRT-PCR analysis of Cdkn1a, Puma, Gadd45a, Trp53, and Ccna2 expression in the bone marrow of p53wt and p53ko mice treated with BTZ (3 mg/kg, 3 h). (C and D) IHC analysis of p21 and Puma in the bone marrow from mice at indicated time points after vehicle (BTZ 0 h) or 3 mg/kg BTZ treatment. (Scale bars, 20 μm.) (E and E′) IHC analysis and quantification of the expression of cleaved caspase 3 in the bone marrow of p53wt and p53ko mice at indicated time points post vehicle (BTZ 0 h) or 3 mg/kg BTZ treatment (n = 3 to 4). (Scale bars, 20 μm.) (F) Quantification of the frequencies of HSPCs and various mature cells in the bone marrow from p53wt and p53mt mice (n = 9 to 10). For B, the indicated P values were calculated by two-way ANOVA using Prism. For C′ and D, the indicated P values were calculated using multiple unpaired t tests using Prism. *P < 0.05; **P < 0.001; ***P < 0.0001; ****P < 0.00001, ns, no significance. The error bars represent the mean (SEM) for each group.

