Fig. 5.
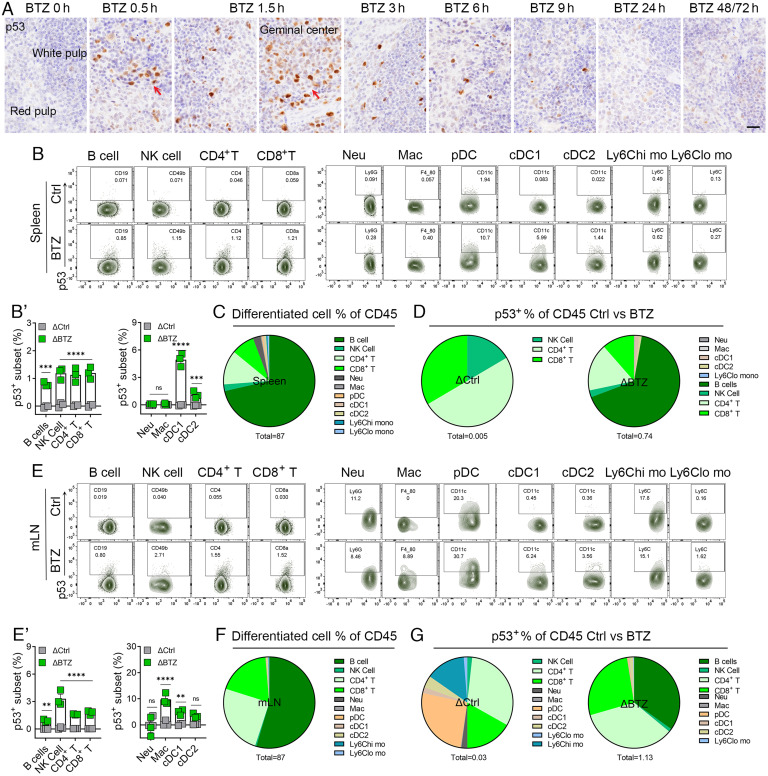
Stabilization of p53 in the spleen and lymph node by bortezomib. (A) IHC analysis of p53 levels in the spleen from mice at indicated time points post vehicle control (Ctrl, BTZ 0 h) or 3 mg/kg BTZ treatment. Red arrows point to the germinal center. (Scale bars, 20 μm.) (B) Representative FACS plots showing the splenocytes stained for p53 from mice treated with Ctrl or BTZ for 1.5 h, gated on matured lymphoid and myeloid cells. (B′) Quantification of p53+ subsets of the indicated splenocytes from mice treated with Ctrl (in grey) or BTZ (in green). (C) Quantification of frequencies of various splenocytes of CD45+ cells from mice treated with Ctrl. 87% of the total CD45+ population was analyzed. (D) Quantification of frequencies of p53+ in splenocytes of CD45+ cells from mice treated with Ctrl and BTZ. ΔCtrl and ΔBTZ were calculated to exclude nonspecific staining (Δ = p53+ frequency − isotype+ frequencies). (E) Representative FACS plots showing staining for p53 in mLN cells from mice treated with Ctrl or BTZ for 1.5 h, gated on matured lymphoid and myeloid cells. (E′) Quantification of p53+ subsets of the indicated mLN cells from mice treated with Ctrl (in grey) or BTZ (in green). (F) Quantification of the frequencies of various CD45+ mLN cells from mice treated with Ctrl. A total of 87% CD45+ cells were analyzed. (G) Quantification of frequencies of p53+ in mLN cells of CD45+ cells from mice treated with Ctrl and BTZ. ΔCtrl and ΔBTZ were calculated to exclude nonspecific staining (Δ = p53+ frequency − isotype+ frequencies). For A–G, n = 3 to 4. For B′ and E′, the indicated P values were calculated by multiple unpaired t tests using Prism. **P < 0.001; ***P < 0.0001; ****P < 0.0001; ns, no significance. The error bars represent the mean (SEM) for each group.

