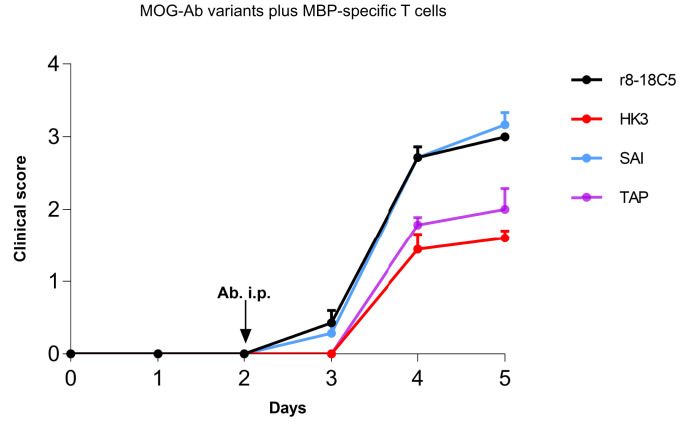
Fig. 2.
Clinical EAE in the model with MBP-specific T cells and mutated MOG-Abs. Lewis rats were injected with MBP-specific T cells that strongly breach the blood–brain barrier. At day 2, the indicated nonmutated MOG-Abs, the mutated MOG-Abs (TAP, SAI), and the control Ab HK3 were injected intraperitoneally. Histology was performed at day 4 or 5. We investigated the development of the clinical disease over time. The clinical score displayed represents the mean + SEM of the following number of animals. r8-18C5 (day 4, n = 5; day 5, n = 2), SAI (day 4, n = 4; day 5, n = 3), TAP (day 4, n = 4; day 5, n = 3), HK3 (day 4, n = 4; day 5, n = 5). Day 4: r8-18C5 vs. SAI = ns; r8-18C5 vs. TAP P ≤ 0.01; 8-18C5 vs. HK3 P < 0.0001; SAI vs. TAP P ≤ 0.01; SAI vs. HK3 P < 0.0001; TAP vs. HK3 = ns. Day 5: r8-18C5 vs. SAI = ns; r8-18C5 vs. TAP P ≤ 0.05; 8-18C5 vs. HK3 P ≤ 0.01; SAI vs. TAP P ≤ 0.01; SAI vs. HK3 P ≤ 0.001; TAP vs. HK3 = ns.

